Operating Expense Ratio Guide for Rental Properties
Understanding your rental property's operating expense ratio (OER) is crucial for measuring efficiency and profitability. This metric tells you exactly what percentage of your rental income goes toward operating costs—and whether you're running a tight ship or hemorrhaging money.
In this comprehensive guide, we'll break down everything you need to know about operating expense ratios, from calculation methods to industry benchmarks, plus actionable strategies to reduce your expenses and maximize returns.
Use our Operating Expense Ratio Calculator to get instant analysis of your property's efficiency.
1 / What is Operating Expense Ratio (OER)?
The Operating Expense Ratio is a financial metric that measures the proportion of a property's gross income consumed by operating expenses. It's one of the most important indicators of how efficiently you're managing your rental property.
The OER Formula
Operating Expense Ratio = (Annual Operating Expenses / Annual Gross Income) × 100
Example:
- Annual Gross Income: $24,000
- Annual Operating Expenses: $10,800
- OER = ($10,800 / $24,000) × 100 = 45%
This means 45% of your rental income goes toward operating costs, leaving 55% for debt service, capital improvements, and profit.
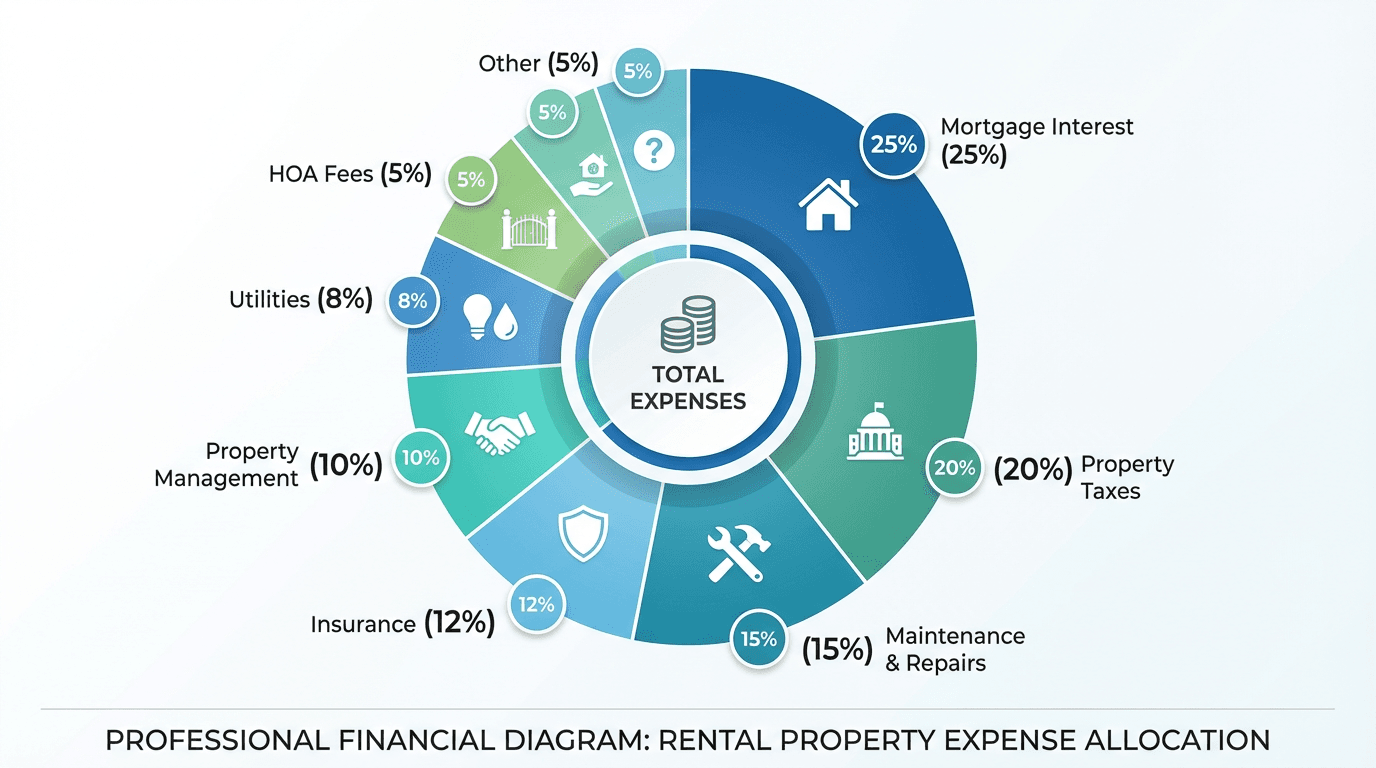
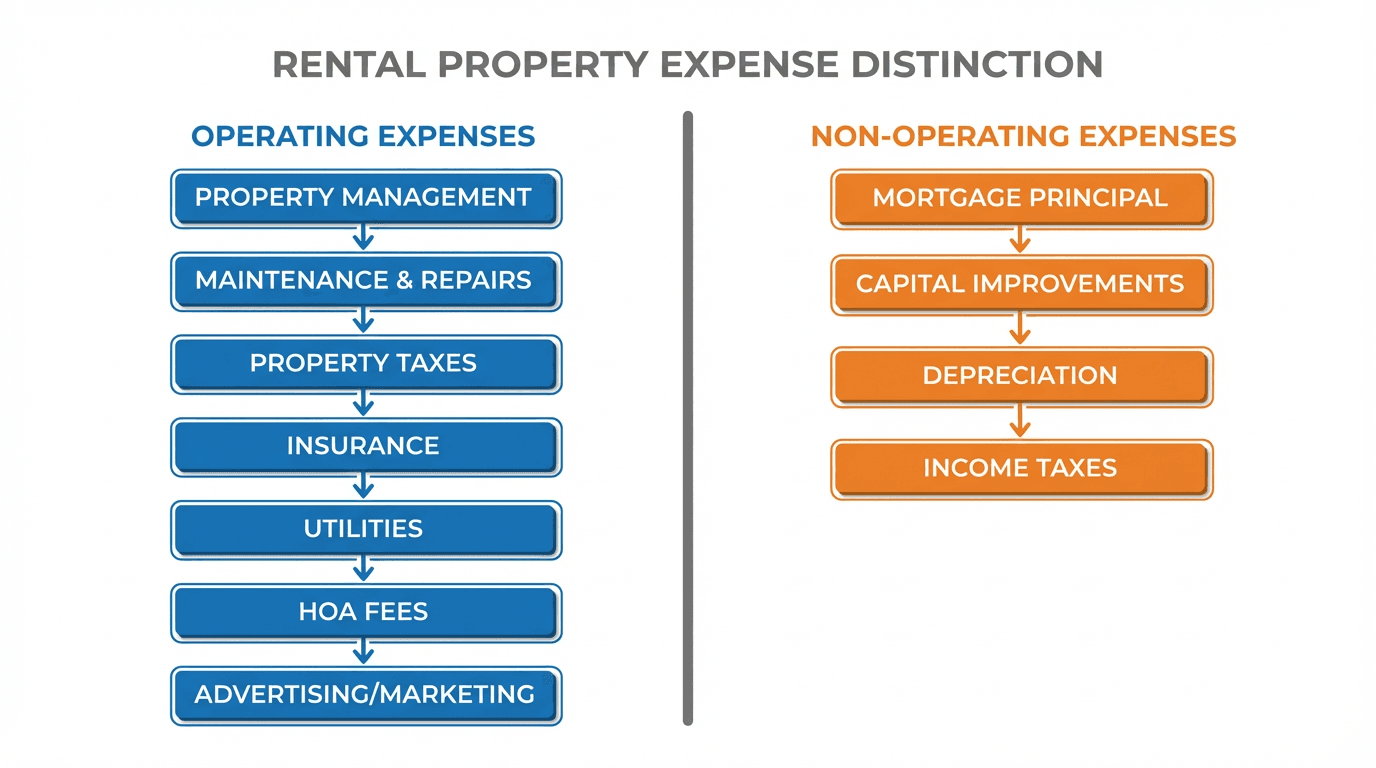
2 / What Counts as Operating Expenses?
Understanding what to include (and exclude) from your OER calculation is critical for accuracy.
✅ Operating Expenses INCLUDE:
Property Management
- Management company fees (typically 8-12% of rent)
- Self-management administrative costs
- Tenant placement fees (if recurring)
Maintenance & Repairs
- Regular maintenance (HVAC servicing, lawn care)
- Repair costs (plumbing, electrical, appliances)
- Pest control
- Snow removal and landscaping
Property Taxes
- Annual property tax bills
- Special assessments
Insurance
- Landlord/rental property insurance
- Liability insurance
- Flood insurance (if required)
Utilities (Landlord-Paid)
- Water and sewer
- Electricity and gas
- Trash collection
- Internet (if included)
HOA Fees
- Monthly or annual association dues
- Special assessments from HOA
Advertising & Marketing
- Listing fees (Zillow, Apartments.com)
- Photography
- Sign rental
- Marketing materials
Professional Services
- Accounting fees
- Legal fees (for standard operations)
- Property inspection costs
❌ Operating Expenses EXCLUDE:
Mortgage Costs
- Principal payments (return of capital)
- Interest payments (financing cost, not operating)
Capital Improvements
- Roof replacement
- New HVAC system
- Kitchen remodel
- Additions or major upgrades
Depreciation
- Non-cash accounting expense
Income Taxes
- Personal income tax on rental income
Why exclude mortgage costs? OER measures how efficiently you run the property operations, independent of how you financed it. Two investors with identical properties but different financing structures should have the same OER.
3 / Industry Benchmarks: What's a Good OER?
Operating expense ratios vary significantly based on property type, location, age, and amenities. Here are typical ranges:
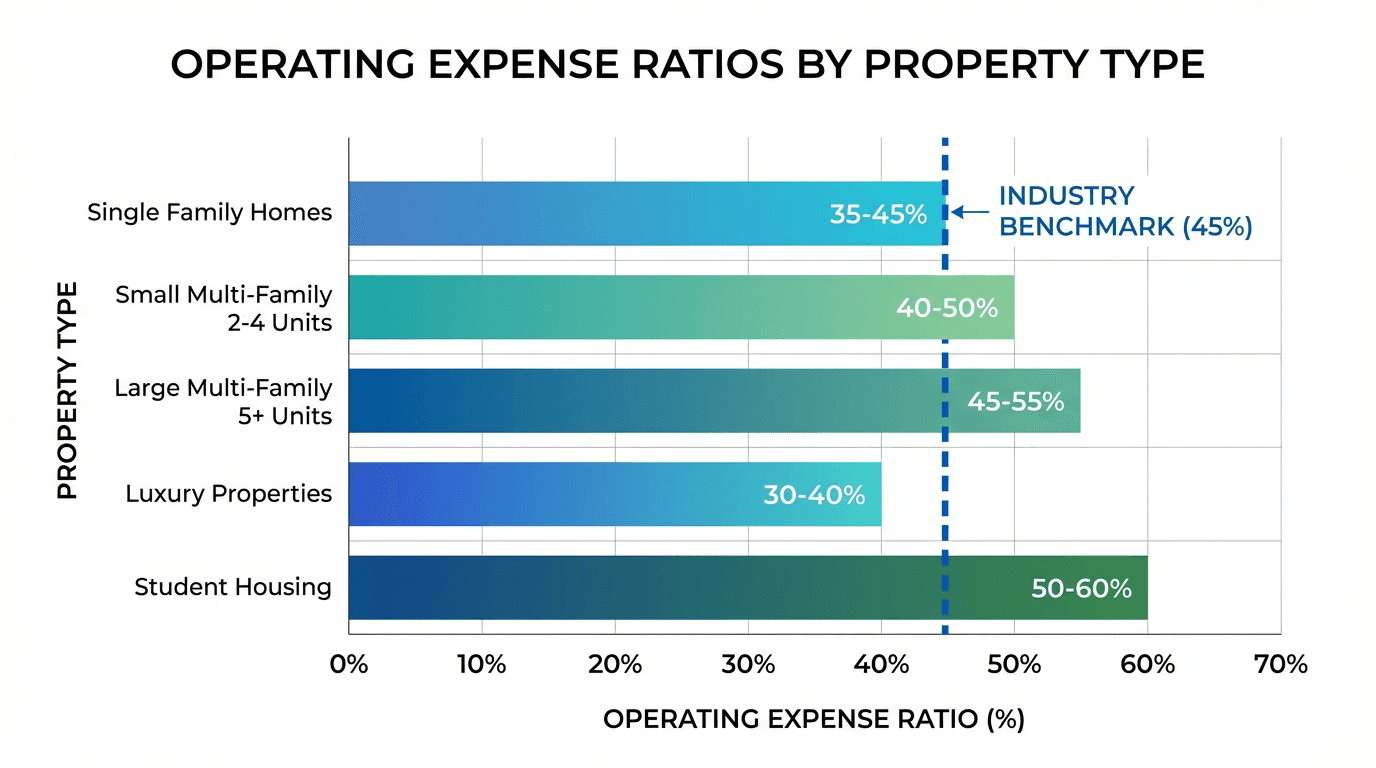
OER by Property Type
| Property Type | Typical Range | Average | |---------------|---------------|---------| | Single-Family Homes | 35-45% | 40% | | Small Multi-Family (2-4 units) | 40-50% | 45% | | Large Multi-Family (5+ units) | 45-55% | 50% | | Luxury Properties | 30-40% | 35% | | Student Housing | 50-60% | 55% |
Why the Variation?
Single-family homes typically have lower OERs because:
- Tenants often pay utilities
- Lower turnover costs
- Less common area maintenance
Multi-family properties have higher OERs due to:
- Common area maintenance
- More frequent turnovers
- Professional management requirements
- Higher insurance costs
Student housing has the highest OER because:
- Frequent turnover (annual leases)
- Higher maintenance needs
- Intensive marketing required
- Parent guarantee verification costs
Interpreting Your OER
Below 40%: 🟢 Excellent efficiency
- Well-maintained property
- Low turnover
- Cost-effective management
- Strong negotiating with vendors
40-50%: 🟡 Good range
- Industry average
- Room for optimization
- Sustainable long-term
50-60%: 🟠 Above average
- Higher operating costs
- Opportunity for improvements
- May reduce profitability
Above 60%: 🔴 Concerning
- Immediate attention needed
- Unsustainable long-term
- Investigate all expense categories
4 / How to Calculate Your OER: Step-by-Step
Let's walk through a real example using a single-family rental property.
Property Profile
- Monthly Rent: $2,000
- Parking Fee: $50
- Monthly Gross Income: $2,050
- Annual Gross Income: $24,600
Monthly Operating Expenses
- Property Management (10%): $200
- Maintenance & Repairs: $150
- Property Tax: $250
- Insurance: $100
- Landscaping: $80
- HOA Fees: $0
- Advertising: $20
- Miscellaneous: $50
- Total Monthly: $850
- Total Annual: $10,200
Calculation
OER = ($10,200 / $24,600) × 100 = 41.46%
Result: This property has an OER of 41.5%, which is in the "good" range for a single-family home.
What About Vacancy?
Some investors include vacancy costs in their OER calculation, but this is debatable:
Pro Inclusion:
- Vacancy is a real operating cost
- More realistic profitability picture
- Better for portfolio analysis
Pro Exclusion:
- OER measures occupied property efficiency
- Vacancy varies too much year-to-year
- Can be tracked separately
Best Practice: Calculate both ways and clearly state which method you're using when comparing properties or communicating with partners.
5 / Cost Reduction Strategies: Lowering Your OER
A high OER doesn't have to be permanent. Here are proven strategies to reduce operating expenses without sacrificing property quality:
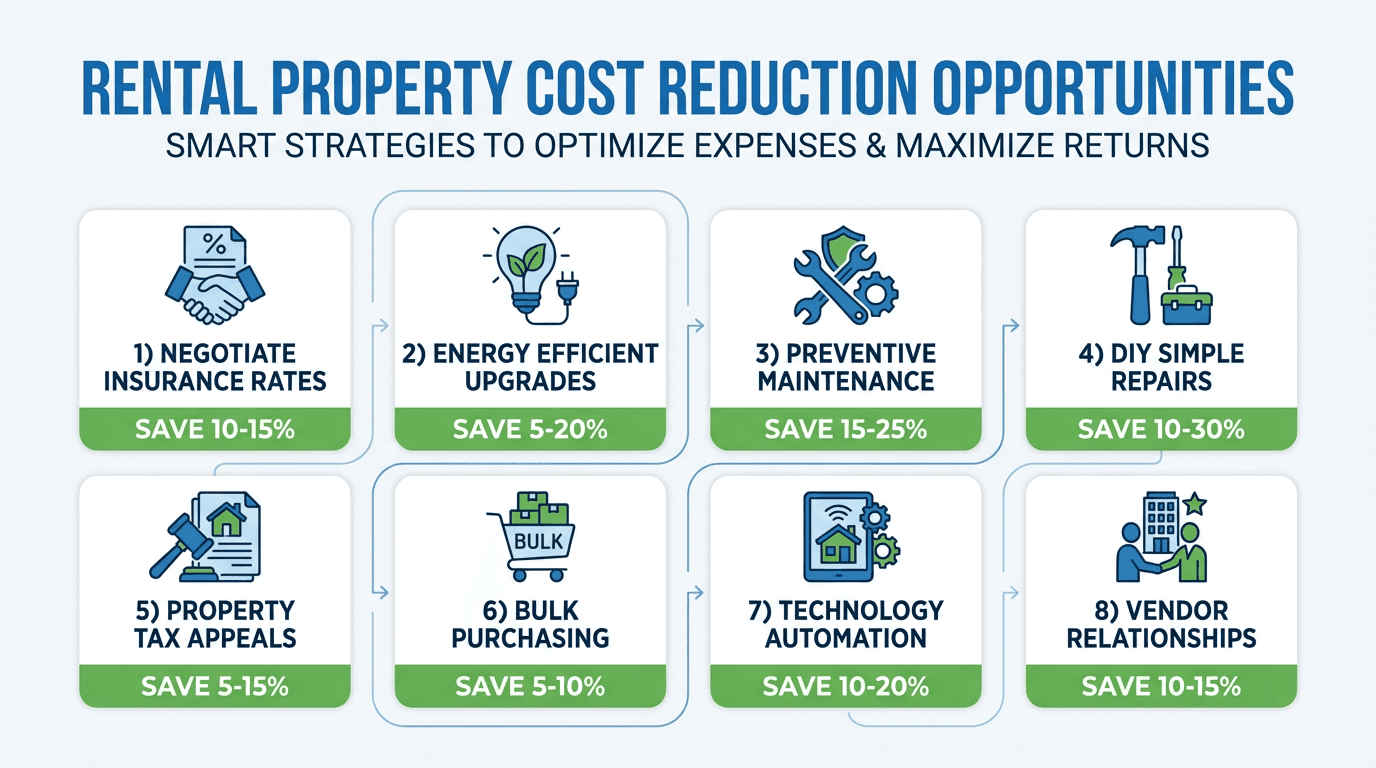
1. Insurance Optimization (Save 10-15%)
Action Steps:
- Shop 3-5 insurance quotes annually
- Bundle multiple properties for discounts
- Increase deductibles (if cash reserves allow)
- Install security systems for premium reductions
- Join landlord associations for group rates
Real Example: Maria reduced her insurance from $1,200/year to $950/year by bundling three properties with one carrier. Savings: 21%
2. Energy Efficiency Upgrades (Save 5-20%)
High-ROI Improvements:
- LED lighting (payback: 6-12 months)
- Programmable thermostats ($15-30/month savings)
- Low-flow fixtures (10-30% water savings)
- Weather stripping and insulation
- Energy-efficient appliances (when replacing)
Real Example: John spent $800 on LED bulbs and programmable thermostats. His utility costs dropped from $120/month to $85/month. Annual savings: $420, payback in 23 months
3. Preventive Maintenance (Save 15-25%)
The 1% Rule: Budget 1% of property value annually for maintenance, but focus on prevention:
Preventive Schedule:
- Monthly: HVAC filter changes, visual inspections
- Quarterly: Gutter cleaning, pest prevention
- Bi-annually: HVAC servicing, water heater flush
- Annually: Roof inspection, pest treatment, appliance check
Cost Comparison:
- Preventive HVAC maintenance: $150-200/year
- Emergency HVAC replacement: $5,000-8,000
- Potential savings: Avoiding one emergency can save 25-50× the preventive cost
4. DIY Simple Repairs (Save 10-30%)
Learn These High-Value Skills:
- Basic plumbing (faucet replacement, toilet repairs)
- Painting and drywall patching
- Light electrical (outlet replacement, fixture installation)
- Landscaping basics
- Minor appliance repairs
What to DIY vs Hire:
| Task | DIY Savings | When to DIY | |------|-------------|-------------| | Painting | 60-80% | If you have time | | Minor plumbing | 50-70% | Non-emergency, simple | | Landscaping | 50-60% | Routine maintenance | | Electrical | 40-60% | Simple, non-permit work | | HVAC repair | Hire a pro | Always hire licensed tech | | Roofing | Hire a pro | Safety and warranty issues |
5. Property Tax Appeals (Save 5-15%)
When to Appeal:
- Assessment increased significantly
- Comparable homes assessed lower
- Property has issues affecting value
- Market values declining
Success Rate: 30-60% of appeals result in reductions
Process:
- Request assessment details from county
- Research comparable properties
- Gather evidence (photos of issues, comparable sales)
- File appeal (usually free or low cost)
- Present case at hearing
Real Example: Chen appealed his $3,200 annual tax bill, arguing comparable properties were assessed 15% lower. His appeal succeeded, reducing the bill to $2,880. Annual savings: $320
6. Bulk Purchasing (Save 5-10%)
For Multi-Property Owners:
- Air filters (buy year's supply)
- Light bulbs
- Cleaning supplies
- Touch-up paint
- Common hardware items
Where to Buy:
- Costco/Sam's Club for household items
- Ferguson or Ferguson for plumbing supplies
- Local contractor supply houses
- Online bulk retailers (Amazon Business)
7. Technology & Automation (Save 10-20%)
Software Investments:
- Property management software ($10-50/unit/month)
- Automated rent collection (reduce admin time)
- Maintenance request tracking
- Automated lease renewals
- Digital document signing
ROI Calculation:
- Software cost: $300/year
- Time saved: 10 hours/month × $30/hour = $300/month
- Annual ROI: 1,100%
8. Vendor Relationship Building (Save 10-15%)
Strategies:
- Use same contractors consistently
- Pay promptly
- Provide multiple job opportunities
- Negotiate annual service contracts
- Ask for loyalty discounts
Real Example: Lisa built relationships with three reliable contractors. She pays 15-20% less than market rate in exchange for guaranteed business and flexible scheduling.
6 / Common OER Mistakes to Avoid
Mistake #1: Including Non-Operating Expenses
Wrong:
OER = ($10,800 operating + $6,000 mortgage interest) / $24,000 = 70%
Right:
OER = $10,800 operating / $24,000 = 45%
Mistake #2: Using Net Income Instead of Gross Income
Always use gross rental income (before expenses), not net income (after expenses).
Mistake #3: Ignoring Property Type Differences
Don't compare your single-family home's OER to multi-family benchmarks. Use appropriate comparisons.
Mistake #4: Forgetting About Irregular Expenses
Annual expenses must be prorated monthly:
- Property tax: $3,000/year = $250/month
- Insurance: $1,200/year = $100/month
- Annual HVAC service: $180/year = $15/month
Mistake #5: Not Tracking Expenses Accurately
Best Practice: Use property management software or dedicated accounting system to track every expense.
7 / OER vs Other Property Metrics
Understanding how OER fits with other important metrics:
OER vs Cap Rate
Cap Rate = Net Operating Income / Property Value
- OER measures expense efficiency
- Cap Rate measures overall return
- Used together for complete picture
Example:
- Property Value: $250,000
- Annual Income: $24,000
- Operating Expenses: $10,800 (OER: 45%)
- NOI: $13,200
- Cap Rate: $13,200 / $250,000 = 5.28%
OER vs Cash-on-Cash Return
Cash-on-Cash = Annual Cash Flow / Cash Invested
- OER ignores financing
- Cash-on-Cash includes mortgage payments
- OER is more useful for operational analysis
OER vs Debt Service Coverage Ratio (DSCR)
DSCR = NOI / Annual Debt Service
- OER measures operating efficiency
- DSCR measures ability to cover mortgage
- Banks use DSCR for lending (typically require 1.25+)
8 / Using OER for Portfolio Management
For multi-property owners, OER becomes even more valuable:
Portfolio OER Calculation
Portfolio OER = Total Operating Expenses / Total Gross Income × 100
Benefits of Portfolio Analysis:
- Identify underperforming properties
- Compare efficiency across markets
- Spot trends and patterns
- Make informed acquisition decisions
Red Flags in Portfolio OER
Property A: OER 38% 🟢 Property B: OER 42% 🟢 Property C: OER 68% 🔴
Property C warrants immediate investigation:
- What's driving high expenses?
- Is property management inefficient?
- Are there deferred maintenance issues?
- Should property be sold?
Portfolio Optimization Strategy
- Identify outliers (>10% from benchmark)
- Investigate root causes (expense category analysis)
- Implement improvements (see cost reduction strategies)
- Monitor progress (monthly OER tracking)
- Consider disposition (if improvements don't work)
9 / OER During Different Market Conditions
Your OER strategy should adapt to market conditions:
Rising Market (Appreciation)
Focus: Maintaining quality to maximize rent growth
- Don't over-cut expenses
- Invest in value-add improvements
- Acceptable to have slightly higher OER for better positioning
Declining Market (Depreciation)
Focus: Expense control and efficiency
- Scrutinize every expense
- Target lower OER for survival
- Consider refinancing to reduce overall costs
High Inflation
Challenge: Operating expenses rise faster than rents (in stabilized leases)
- Renegotiate vendor contracts
- Implement energy efficiency upgrades
- Consider shorter lease terms to adjust rents more frequently
Recession
Priority: Cash flow preservation
- Reduce discretionary expenses
- Focus on tenant retention (lower turnover costs)
- Delay non-essential maintenance
- Negotiate payment plans rather than evict
10 / Action Plan: Optimizing Your OER
Follow this 90-day plan to analyze and improve your operating expense ratio:
Month 1: Analysis
Week 1-2: Data Collection
- [ ] Gather 12 months of income records
- [ ] Compile all expense receipts and records
- [ ] Categorize expenses properly
- [ ] Calculate current OER
Week 3-4: Benchmarking
- [ ] Research OER benchmarks for your property type
- [ ] Compare to local market standards
- [ ] Identify expense categories above average
- [ ] Prioritize improvement opportunities
Month 2: Planning
Week 5-6: Vendor Review
- [ ] Get 3 quotes for insurance
- [ ] Review property management fees
- [ ] Evaluate maintenance contracts
- [ ] Research property tax appeal opportunity
Week 7-8: Improvement Planning
- [ ] Create preventive maintenance schedule
- [ ] Identify energy efficiency upgrades
- [ ] List DIY opportunities
- [ ] Set OER reduction goals
Month 3: Implementation
Week 9-10: Quick Wins
- [ ] Switch insurance if better rate found
- [ ] Implement preventive maintenance schedule
- [ ] Install LED bulbs
- [ ] Set up expense tracking system
Week 11-12: Long-term Setup
- [ ] File property tax appeal (if warranted)
- [ ] Establish vendor relationships
- [ ] Schedule energy audit
- [ ] Create annual maintenance budget
11 / Tools & Resources
Use Our Free Calculator
Operating Expense Ratio Calculator
- Instant OER calculation
- Industry benchmark comparison
- Expense breakdown visualization
- Cost reduction recommendations
Recommended Tools
Expense Tracking:
- Property management software (Buildium, Appfolio)
- Expense Tracking Template (free download)
- QuickBooks for landlords
Cost Comparison:
- Insurance quote aggregators (Policygenius, Insurify)
- Contractor bidding platforms (Angi, HomeAdvisor)
- Energy audit services (utility company programs)
Industry Data:
- National Apartment Association (NAA) income/expense reports
- Institute of Real Estate Management (IREM) benchmarks
- Local apartment association data
Key Takeaways
✅ Operating Expense Ratio measures what percentage of gross income goes to operating costs
✅ Target OER ranges: 35-45% single-family, 40-50% small multi-family, 45-55% large multi-family
✅ Exclude mortgage payments, capital improvements, and depreciation from OER calculations
✅ Focus on preventive maintenance, insurance shopping, energy efficiency, and vendor relationships to reduce OER
✅ Track OER monthly and compare to benchmarks to identify problems early
✅ Use OER alongside cap rate, cash-on-cash return, and DSCR for complete property analysis
✅ Portfolio owners should calculate OER for each property to identify underperformers
Next Steps
- Calculate your current OER using our free calculator
- Compare to benchmarks for your property type
- Identify top 3 expense reduction opportunities
- Implement quick wins this month
- Track progress monthly
A well-managed operating expense ratio is the foundation of profitable rental property investing. By understanding your numbers, comparing to benchmarks, and systematically reducing costs, you can significantly improve your property's performance and your investment returns.
Ready to optimize your property expenses? Use our Operating Expense Ratio Calculator to get started today.
Related Articles
- How to Calculate ROI on Rental Properties
- Rental Property Accounting: Bookkeeping Basics
- Property Management Tax Deductions Guide
- How to Set the Right Rent Price
Related Resources
Related Content
📝 Fill Vacancies Faster: Marketing Guide for Landlords
Discover the most effective marketing channels for rental properties and learn how to reduce vacancy times while attracting quality tenants.
📝 How to Calculate ROI on Rental Properties: A Step-by-Step Guide
Calculate ROI on rental properties. Master cash-on-cash return, cap rate, and NOI for smart investment decisions.
📝 Best Cities to Invest in Rental Properties: 2026 Analysis
Best cities for rental property investment in 2026. Analysis of ROI, population growth, job markets, and opportunities.
🔧 ROI Calculator
Calculate return on investment
🔧 Property Investment Analyzer
Comprehensive property analysis tool
🔧 BRRRR Calculator
Analyze buy-rehab-rent-refinance deals