
Operating Expense Ratio Calculator
Calculate your rental property's operating expense ratio to understand efficiency, compare to industry benchmarks, and identify cost reduction opportunities.
The Efficiency Metric Lenders Look at First
The operating expense ratio (OER) answers a deceptively simple question: out of every rent dollar you collect, how many cents go to running the property? It is the fastest way to spot an inefficient operation, because it normalizes costs against income - a $700 monthly expense load means something completely different on a $1,400 rental than on a $2,800 one. Appraisers, underwriters, and buyers of small multifamily all reach for this ratio before almost any other number.
Enter your monthly rent, any other income (parking, laundry, pet fees), and each operating expense line. The calculator returns your OER, your net operating income, a visual breakdown of where the money goes, and - importantly - a comparison against the typical range for your property type, from single-family through student housing.
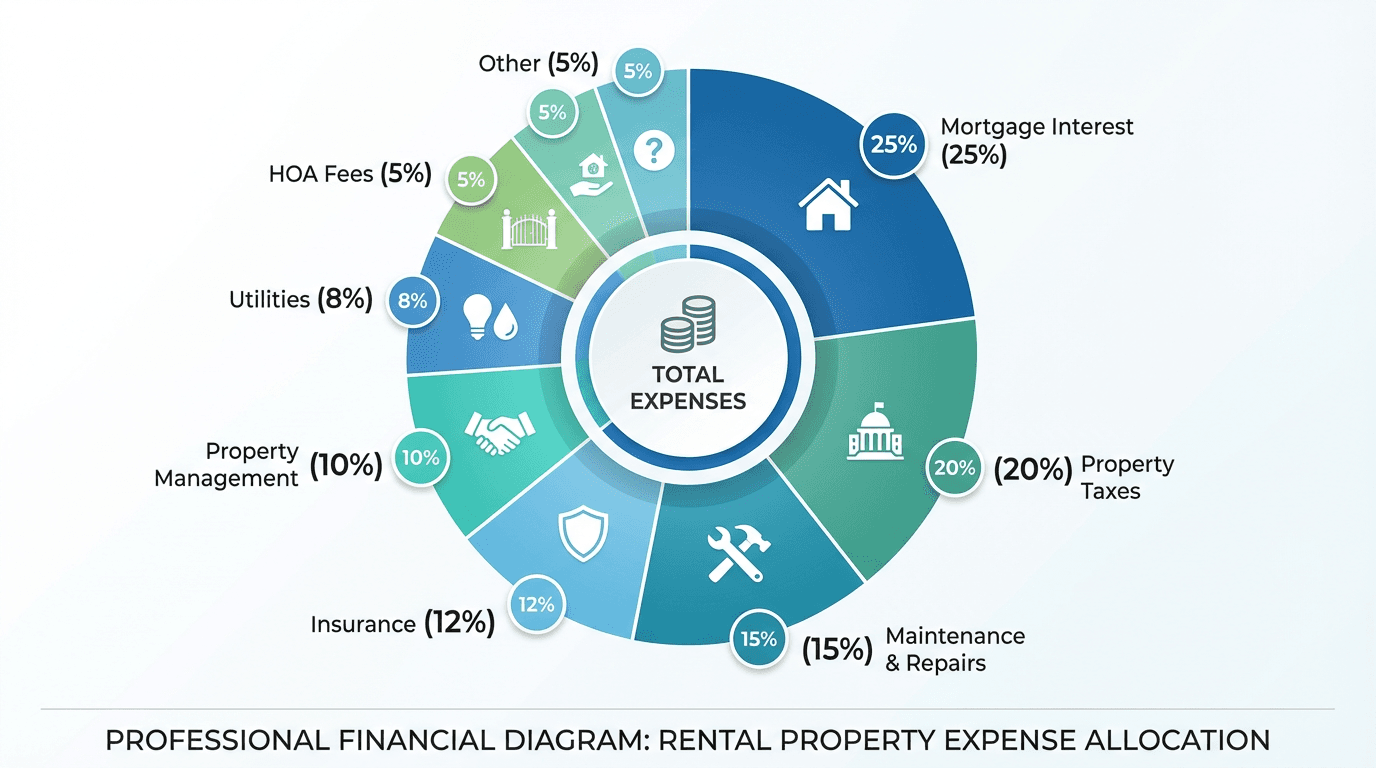
Income & Expenses
Monthly Income
Parking, laundry, pet fees, etc.
Monthly Operating Expenses
Your Results
Average: 40% for single family
Monthly: $0.00
What is Operating Expense Ratio?
The Operating Expense Ratio (OER) measures the efficiency of your rental property by comparing annual operating expenses to gross income. It shows what percentage of your rental income goes toward operating costs.
Formula: OER = (Annual Operating Expenses / Annual Gross Income) × 100
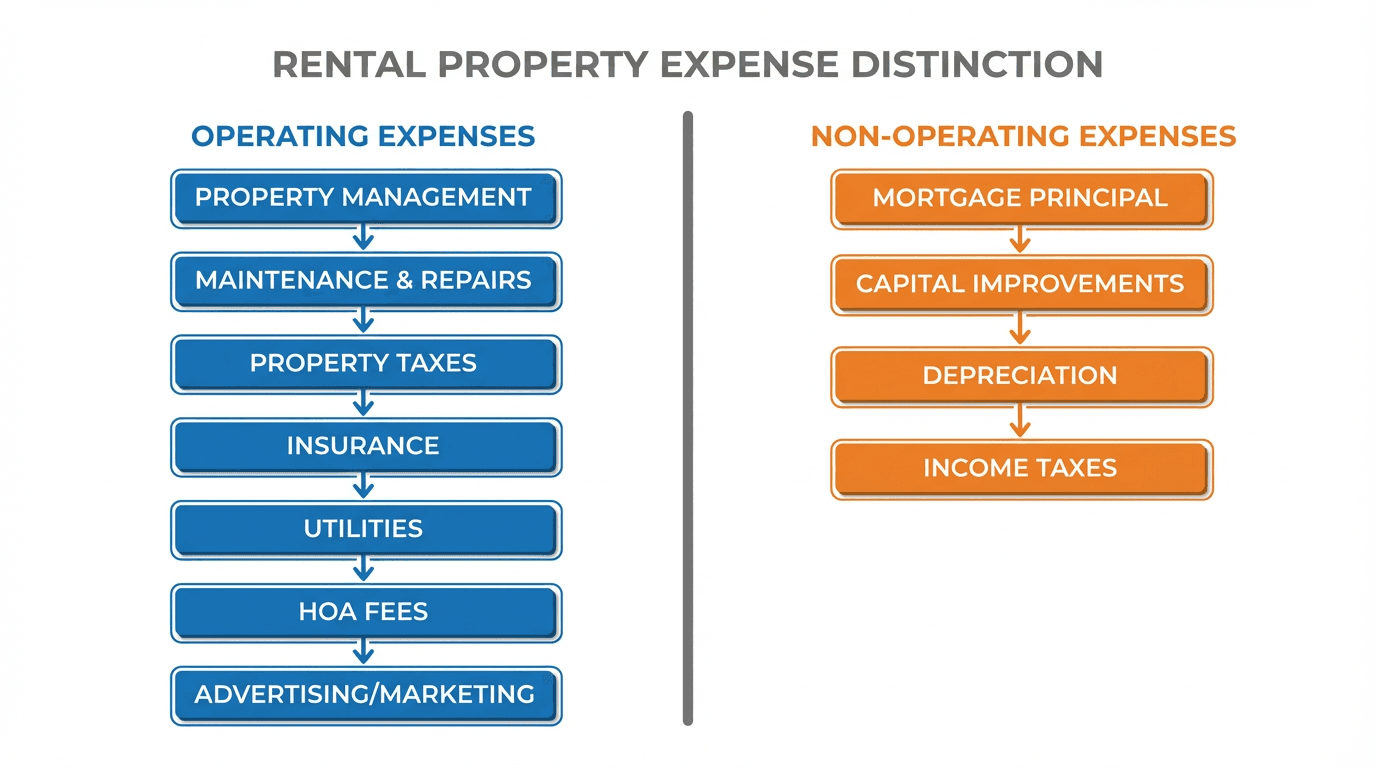
What's Included in Operating Expenses?
- ✓ Property management fees
- ✓ Maintenance and repairs
- ✓ Property taxes
- ✓ Insurance premiums
- ✓ Utilities (if landlord-paid)
- ✓ HOA fees
- ✓ Advertising and marketing
What's NOT Included?
- ✗ Mortgage principal payments
- ✗ Mortgage interest (for OER calculation)
- ✗ Capital improvements
- ✗ Depreciation
- ✗ Income taxes
Understanding Operating vs Non-Operating Expenses
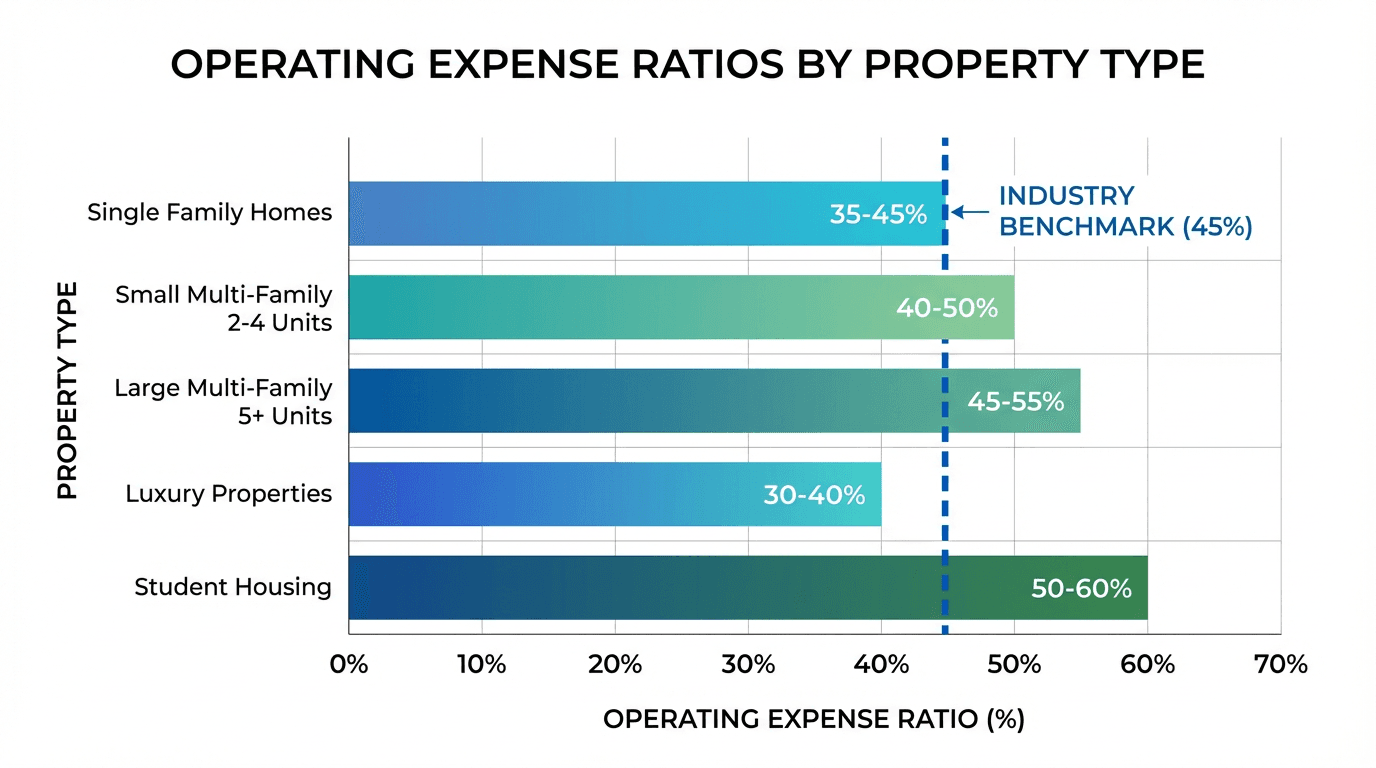
Industry Benchmarks by Property Type
Interpreting Your Results
Below 40%: Excellent efficiency. You're operating at lower costs than industry average.
40-50%: Good range for most properties. Typical operating efficiency for well-managed rentals.
50-60%: Higher than average. Look for cost reduction opportunities, especially for multi-family properties.
Above 60%: Very high expenses. Immediate action needed to identify and reduce costs.
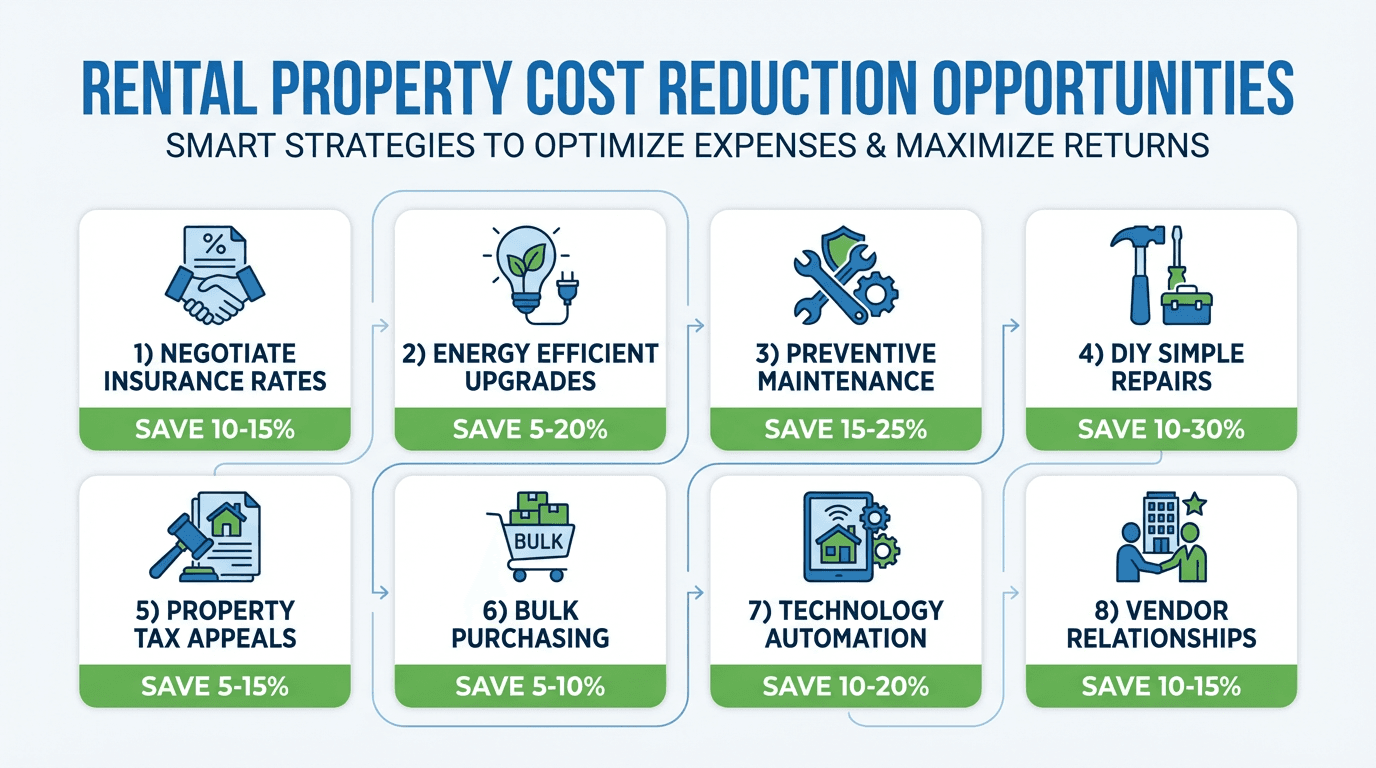
Cost Reduction Opportunities
Immediate Actions
- • Shop around for insurance quotes annually
- • Review property tax assessment for errors
- • Implement preventive maintenance schedule
- • Install energy-efficient appliances and lighting
Long-term Strategies
- • Build relationships with reliable, affordable vendors
- • Invest in durable, low-maintenance materials
- • Use property management software to reduce admin costs
- • Consider bulk purchasing for multi-property portfolios
Related Resources
Financial Calculators
Expense Management
Educational Content
Worked Example: A Single-Family Rental at 40%
Take a single-family home renting for $1,800 a month plus $50 in pet rent - $22,200 in annual gross income. Monthly operating costs: $180 for property management (10% of rent), $150 maintenance reserve, $250 property taxes, $110 insurance, $10 in advertising amortized across the year, and $40 miscellaneous. That is $740 a month, or $8,880 a year. The OER is $8,880 divided by $22,200 - exactly 40%, landing right at the single-family average of the 35-45% benchmark band, and leaving $13,320 in net operating income.
Now see how sensitive the ratio is to a single line. If the insurance premium doubles to $220 at renewal - common in storm-exposed states lately - the ratio climbs to about 46% and NOI drops by $1,320, before anything else changes. Because valuation on income property is a multiple of NOI, that one premium increase quietly erases roughly $16,000-22,000 of value at a 6-8% cap rate. Tracking your OER each year is how you catch that erosion while it is still fixable.
Frequently Asked Questions
What is a good operating expense ratio for a rental property?
It depends on the asset class. Single-family rentals typically run 35-45% because tenants pay most utilities and there are no common areas. Small multifamily runs 40-50%, large multifamily 45-55% once staffing and common-area costs enter the picture, luxury rentals 30-40% thanks to high rents against similar fixed costs, and student housing 50-60% due to turnover and wear. Compare against the right benchmark - a 48% ratio is fine for a fourplex and a warning sign for a single-family home.
Does the operating expense ratio include my mortgage payment?
No. Operating expenses cover the costs of running the property - management, maintenance, taxes, insurance, utilities, HOA dues, advertising - but exclude debt service and capital expenditures. That is deliberate: it keeps the ratio comparable across properties regardless of how each one is financed, and it is the same convention appraisers and commercial lenders use when they evaluate NOI.
My ratio is above the benchmark - where do I look first?
Start with the expense breakdown to find your largest line items. The usual culprits, in order: property taxes that deserve an assessment appeal, insurance that has not been shopped in two or more years, management fees above the local going rate, and owner-paid utilities that could be separately metered or billed back. One structural fix - like a successful tax protest or switching insurers - typically moves the ratio more than a year of small economies.
How does the operating expense ratio relate to the 50% rule?
The 50% rule is a rough screening shortcut that assumes operating expenses will consume half of gross rent over the long run, including reserves for vacancy and big-ticket repairs. Your calculated ratio in a given year will usually come in lower because it reflects actual bills, not long-run averages that include an occasional roof or HVAC replacement. Use the 50% rule when screening deals with minimal data, and your real ratio when managing a property you own.