Free Break-Even Calculator for Rental Property | Cash Flow Analysis
Break-Even Calculator: Rental Property Cash Flow Analysis Guide
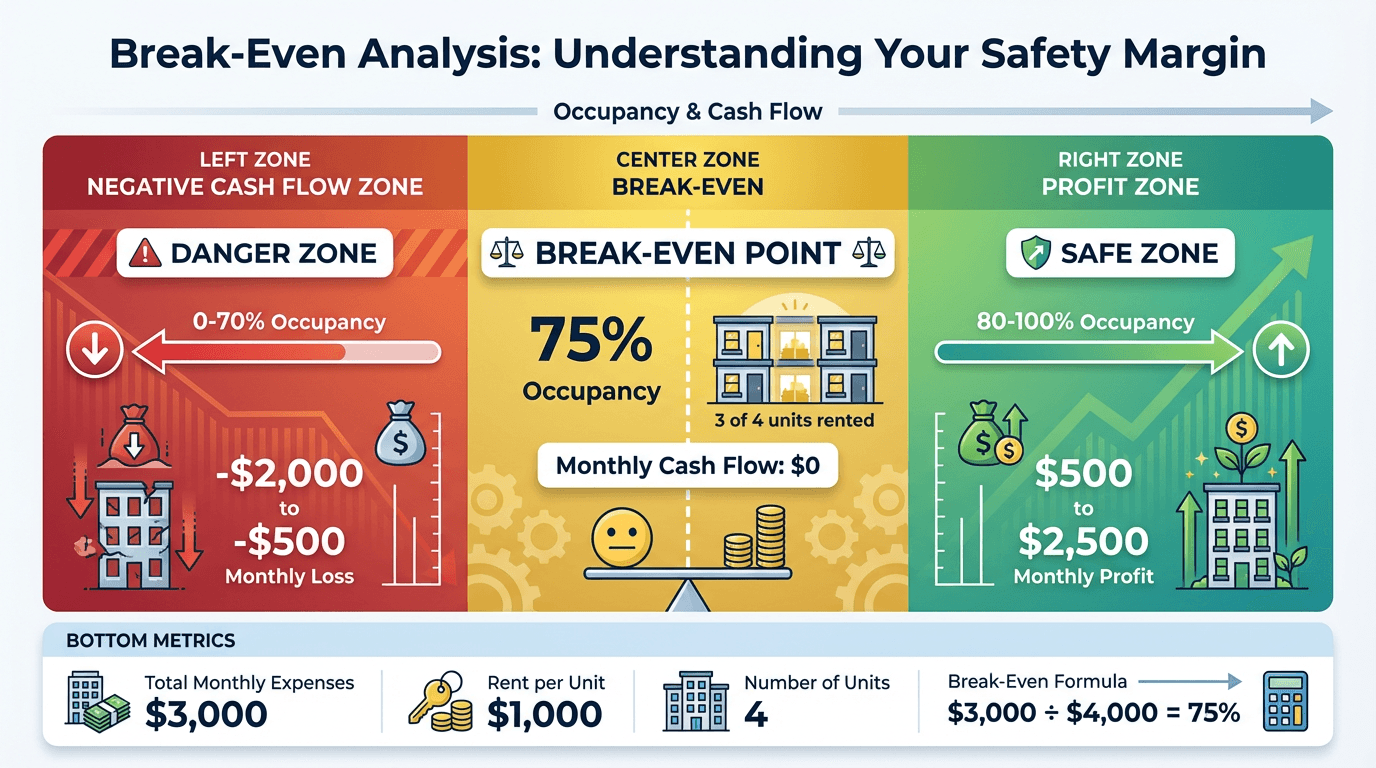
What's the minimum occupancy you need to avoid losing money on your rental property? That's your break-even point—and it's one of the most critical metrics for evaluating investment risk.
The Break-Even Formula:
Break-Even Occupancy = Total Monthly Expenses ÷ Gross Potential Rent
Safety Margin = Current Occupancy - Break-Even Occupancy
A property with a 90% break-even point is walking a tightrope. One vacancy and you're losing money. But a property with a 60% break-even point? You have room to breathe, plan, and weather market downturns.
What is Break-Even Analysis?
Break-even analysis determines the minimum occupancy rate (or revenue) needed to cover all operating expenses without making a profit or loss.
The Basic Concept
Total Monthly Expenses: All costs you must pay regardless of occupancy
- Mortgage (principal and interest)
- Property taxes
- Insurance
- HOA fees (if applicable)
- Property management
- Maintenance reserves
- Utilities (if owner-paid)
Gross Potential Rent: Maximum rental income if 100% occupied
- Number of units × average rent per unit
Break-Even Point: The occupancy percentage where income equals expenses
Why Break-Even Analysis Matters
1. Risk Assessment
Your break-even point tells you how vulnerable you are to vacancies and market downturns.
High Break-Even Point (85% or higher):
- High risk
- Little margin for error
- One or two vacancies = negative cash flow
- Difficult to weather economic downturns
Moderate Break-Even Point (70% to 85%):
- Moderate risk
- Some flexibility
- Need strong tenant retention
- Requires adequate cash reserves
Low Break-Even Point (Below 70%):
- Low risk
- Strong safety margin
- Can handle multiple vacancies
- Sustainable long-term investment
2. Investment Comparison
Use break-even analysis to compare different investment opportunities.
Property A:
- Purchase Price: $400,000
- Monthly Expenses: $3,500
- Gross Potential Rent: $4,000
- Break-Even: 87.5%
- Assessment: HIGH RISK
Property B:
- Purchase Price: $350,000
- Monthly Expenses: $2,400
- Gross Potential Rent: $4,000
- Break-Even: 60%
- Assessment: LOW RISK
Even though Property A generates more total cash flow at 100% occupancy, Property B is the safer investment because it can withstand vacancies.
3. Pricing Strategy
Break-even analysis helps you determine:
- Minimum rent levels to stay profitable
- How much you can reduce rent to fill vacancies
- Whether offering concessions makes sense
Example:
- Break-Even Point: 75%
- Current Occupancy: 80%
- You have a 5% safety margin
If you're considering reducing rent 10% to fill units faster, you need to calculate whether the increased occupancy offsets the lower rent.
4. Expense Management
By understanding your break-even point, you can identify which expenses to focus on reducing.
Reducing your break-even point from 85% to 70% dramatically improves your investment's resilience.
How to Calculate Your Break-Even Point
Step 1: Calculate Total Monthly Expenses
Add up all fixed and variable costs:
Fixed Costs (Don't Change with Occupancy):
- Mortgage payment (P&I): $2,500
- Property taxes: $500
- Insurance: $200
- HOA fees: $150
- Total Fixed: $3,350
Variable Costs (Can Change with Occupancy):
- Property management (8% of collected rent): Variable
- Maintenance reserves: $300
- Utilities (if owner-paid): $200
- Total Variable: $500
Total Monthly Expenses: $3,850
Note: For break-even analysis, calculate property management based on gross potential rent (not actual collected rent).
Step 2: Calculate Gross Potential Rent
Formula: Number of Units × Average Rent per Unit
Example:
- 4-unit property
- Average rent: $1,200/unit
- Gross Potential Rent: 4 × $1,200 = $4,800/month
Step 3: Calculate Break-Even Occupancy
Formula: Total Expenses ÷ Gross Potential Rent
Example:
- Total Expenses: $3,850
- Gross Potential Rent: $4,800
- Break-Even: $3,850 ÷ $4,800 = 80.2%
You need at least 80.2% occupancy (approximately 3.2 out of 4 units rented) to break even.
Step 4: Calculate Your Safety Margin
Formula: Current Occupancy - Break-Even Occupancy
Example:
- Current Occupancy: 90%
- Break-Even: 80.2%
- Safety Margin: 90% - 80.2% = 9.8%
You have a 9.8% cushion. You can afford to lose almost one full unit (out of 4) before breaking even.
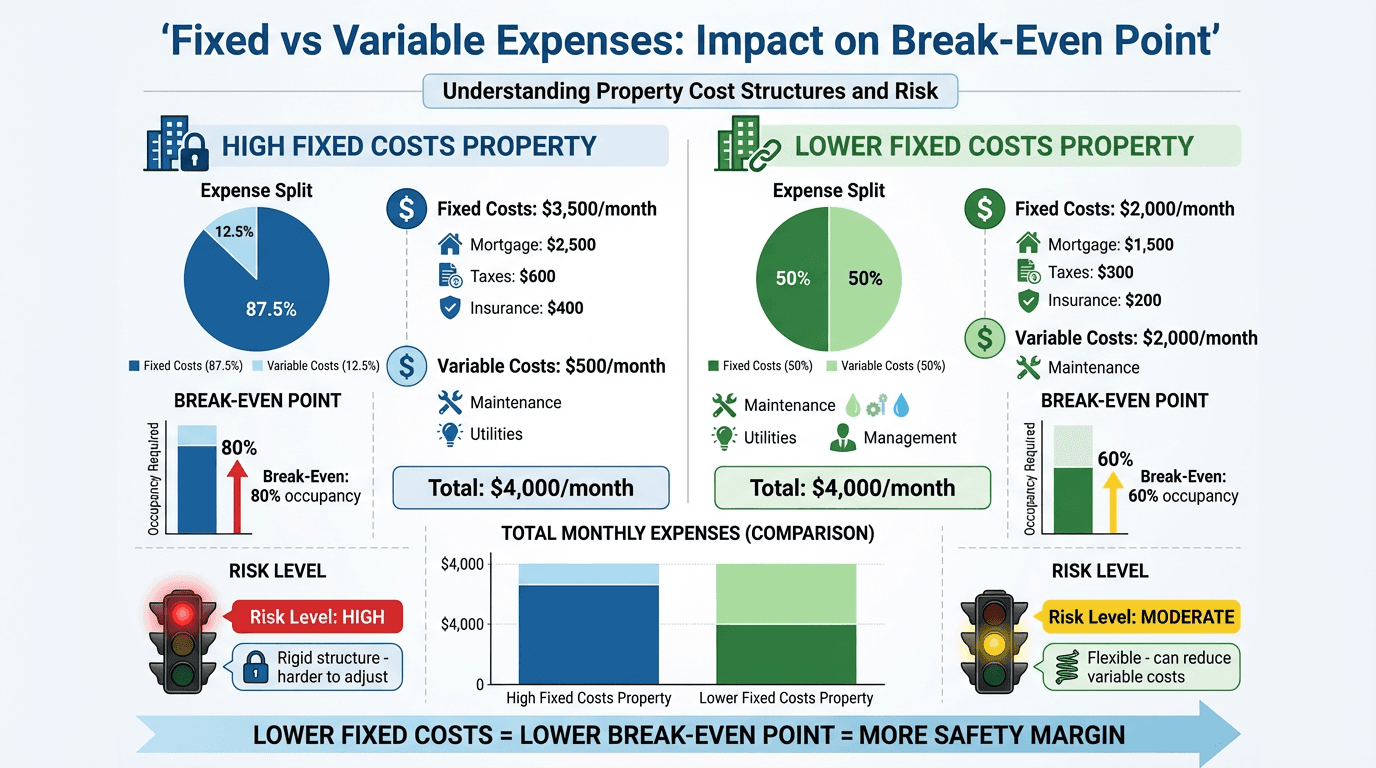
Fixed vs Variable Expenses: Impact on Break-Even
Understanding the difference between fixed and variable expenses is crucial for break-even analysis.
Fixed Expenses
Definition: Costs that don't change based on occupancy.
Examples:
- Mortgage payment
- Property taxes
- Insurance
- HOA fees
Impact on Break-Even: High fixed costs increase your break-even point and risk.
Property with 90% Fixed Costs:
- Total Expenses: $10,000/month
- Fixed: $9,000
- Variable: $1,000
- Even at 50% occupancy, you still owe $9,000
- High break-even point (typically 80% to 90%)
Variable Expenses
Definition: Costs that change based on occupancy or activity level.
Examples:
- Utilities (if tenant-paid, you save when vacant)
- Property management (percentage of collected rent)
- Turnover costs
- Some maintenance
Impact on Break-Even: Higher variable costs (as a percentage) lower your break-even point.
Property with 40% Variable Costs:
- Total Expenses: $6,000/month (at 100% occupancy)
- Fixed: $3,600
- Variable: $2,400
- At 50% occupancy, expenses drop to $4,800
- Lower break-even point (typically 60% to 75%)
Strategy: Convert Fixed to Variable Costs
Ways to Reduce Fixed Costs:
-
Make Tenants Pay Utilities
- Convert from owner-paid to tenant-paid utilities
- Reduces your fixed costs
- Lowers break-even point
-
Tenant-Paid Landscaping/Snow Removal
- Charge tenants directly for these services
- Shifts cost from fixed to variable
-
Use Percentage-Based Services
- Property management (8% to 10% of collected rent)
- Automatically scales with occupancy
Break-Even Analysis by Property Type
Single-Family Rental
Characteristics:
- One tenant
- 100% occupied or 0% occupied (no in-between)
- Break-even analysis is all-or-nothing
Example:
- Monthly Expenses: $1,800
- Monthly Rent: $2,200
- Cash Flow (occupied): +$400
- Cash Flow (vacant): -$1,800
Break-Even: 81.8% occupancy over time
If your property is vacant more than 18.2% of the year (roughly 2.2 months), you lose money.
Strategy: Focus on tenant retention and quick turnovers.
Small Multi-Family (2 to 4 Units)
Characteristics:
- Multiple income streams
- Can be partially occupied
- More flexible break-even scenarios
Example (Duplex):
- Monthly Expenses: $2,400
- Rent per Unit: $1,400
- Gross Potential Rent: $2,800
- Break-Even: 85.7%
Scenarios:
- 2 units rented (100%): +$400 cash flow
- 1 unit rented (50%): -$1,000 cash flow
Break-Even: You need at least 1.7 units rented on average.
Strategy: Stagger lease end dates to avoid multiple simultaneous vacancies.
Large Multi-Family (5+ Units)
Characteristics:
- Many income streams
- Law of averages applies
- More predictable occupancy
Example (12-Unit Apartment):
- Monthly Expenses: $18,000
- Rent per Unit: $1,800
- Gross Potential Rent: $21,600
- Break-Even: 83.3%
Scenarios:
- 12 units rented (100%): +$3,600 cash flow
- 11 units rented (91.7%): +$1,800 cash flow
- 10 units rented (83.3%): $0 cash flow
- 9 units rented (75%): -$1,800 cash flow
Break-Even: You need at least 10 units rented (83.3% occupancy).
Strategy: Maintain high tenant satisfaction to keep occupancy above 90%.
Commercial Property (Retail, Office, Industrial)
Characteristics:
- Longer lease terms (3 to 10 years)
- Higher tenant improvement costs
- Longer vacancy periods
- Often triple-net leases (tenant pays most expenses)
Example (Strip Mall with Triple-Net Leases):
- Monthly Expenses: $5,000 (mostly mortgage, property tax, insurance)
- Gross Potential Rent: $15,000
- Break-Even: 33.3%
Triple-net leases dramatically lower break-even points because tenants pay most operating expenses.
Strategy: Focus on creditworthy tenants with long leases.
Break-Even Decision Framework
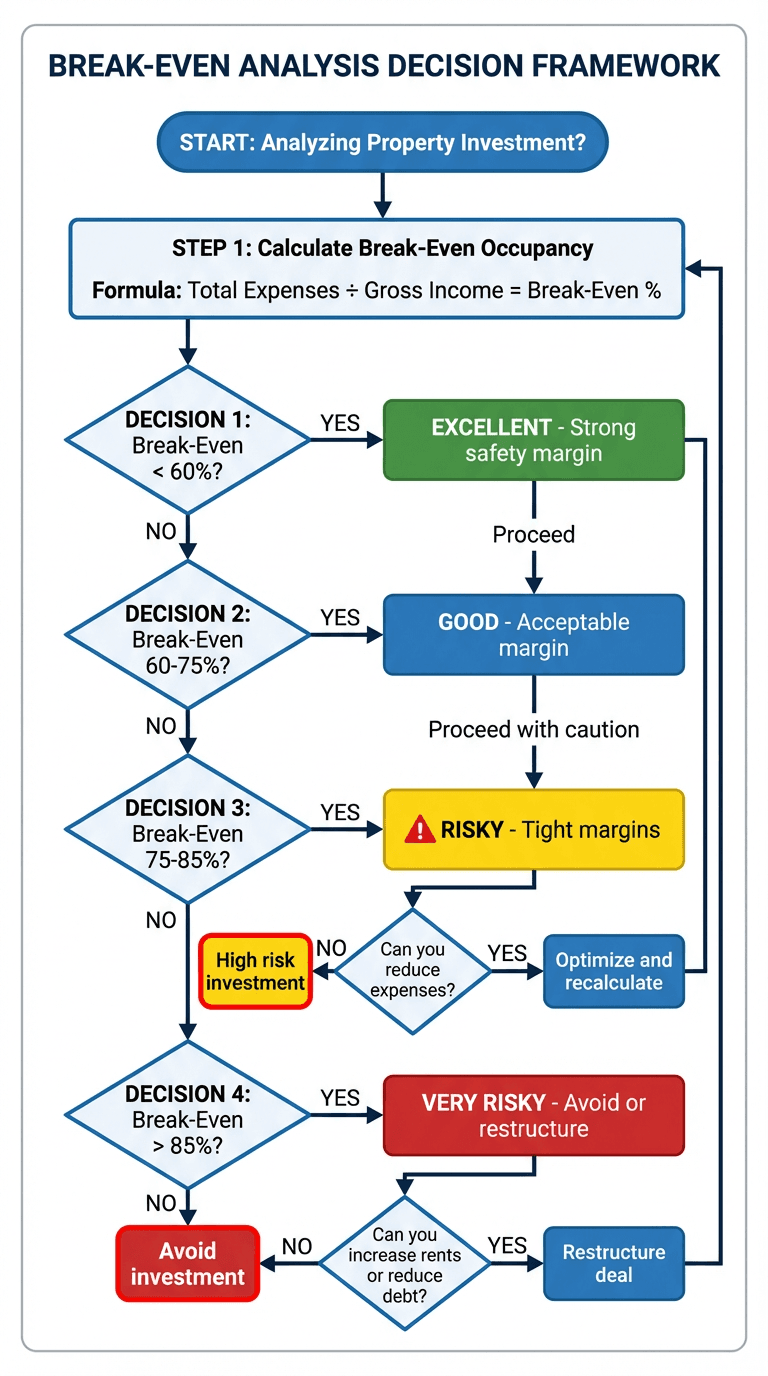
Risk Level 1: Break-Even > 85% (HIGH RISK)
Characteristics:
- Little margin for error
- One vacancy = negative cash flow
- Difficult to sustain long-term
Red Flags:
- High mortgage payment relative to rent
- High fixed expenses
- Low rent growth market
- Declining area
Actions to Consider:
-
Reduce Expenses
- Refinance to lower mortgage payment
- Appeal property tax assessment
- Shop for better insurance rates
- Negotiate lower property management fees
-
Increase Income
- Raise rents (if market allows)
- Add value-add improvements (justify higher rent)
- Charge for parking, storage, pets
- Convert to short-term rentals (if legal and profitable)
-
Reconsider the Investment
- May not be sustainable
- Consider selling if you can't improve break-even
- Look for better markets or properties
Risk Level 2: Break-Even 70% to 85% (MODERATE RISK)
Characteristics:
- Some flexibility
- Can handle 1 to 2 vacancies
- Requires active management
Actions to Take:
-
Build Cash Reserves
- Save 6 to 12 months of expenses
- Plan for extended vacancies
- Budget for unexpected repairs
-
Focus on Tenant Retention
- Respond quickly to maintenance requests
- Keep units in good condition
- Offer lease renewal incentives
- Screen tenants carefully
-
Monitor Market Conditions
- Track occupancy trends in your area
- Stay informed about competition
- Adjust pricing strategy accordingly
-
Plan for Turnover
- Budget for turnover costs
- Have a marketing plan ready
- Pre-screen prospective tenants
- Minimize days vacant between tenants
Risk Level 3: Break-Even < 70% (LOW RISK)
Characteristics:
- Strong safety margin
- Can handle multiple vacancies
- Sustainable long-term
Advantages:
- Flexibility to raise rents gradually
- Room for expense increases
- Can offer concessions to attract quality tenants
- Weather economic downturns
Strategies:
-
Optimize for Quality
- Focus on attracting and retaining best tenants
- Invest in property improvements
- Don't compete on price alone
-
Plan for Growth
- Use excess cash flow to pay down mortgage
- Save for next investment
- Reinvest in value-add improvements
-
Maintain Margin
- Don't over-leverage on refinance
- Keep expenses controlled
- Monitor break-even point regularly
Market Conditions and Break-Even Analysis
Your break-even point alone doesn't tell the full story. Market conditions determine how risky your break-even point really is.
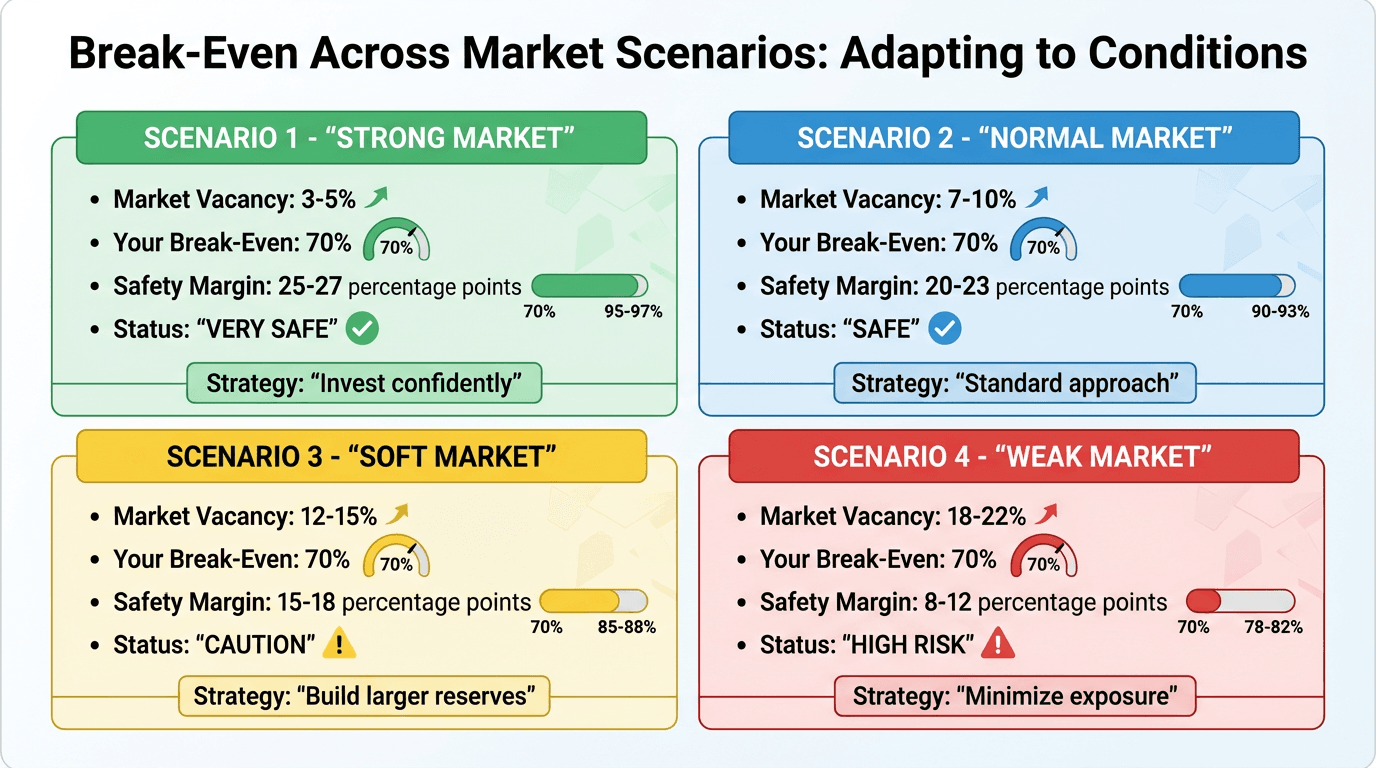
Strong Market
Characteristics:
- High occupancy rates (95%+)
- Rent growth 4% to 6% annually
- Low vacancy periods
- High tenant demand
Break-Even Impact: Even a 75% to 80% break-even point is manageable because occupancy is consistently high.
Example:
- Break-Even: 75%
- Market Occupancy: 95%
- Safety Margin: 20%
Strategy: Focus on growth and scaling. This is a good time to leverage equity for additional properties.
Stable Market
Characteristics:
- Occupancy rates 90% to 93%
- Rent growth 2% to 3% annually
- Predictable vacancy patterns
- Moderate tenant demand
Break-Even Impact: Break-even under 75% is comfortable. 75% to 85% requires attention.
Example:
- Break-Even: 78%
- Market Occupancy: 92%
- Safety Margin: 14%
Strategy: Maintain operations, focus on tenant retention, and build reserves.
Soft Market
Characteristics:
- Occupancy rates 85% to 88%
- Flat or negative rent growth
- Longer vacancy periods
- Weaker tenant demand
Break-Even Impact: Break-even over 75% becomes risky. Safety margins shrink.
Example:
- Break-Even: 80%
- Market Occupancy: 86%
- Safety Margin: 6% (thin margin)
Strategy:
- Build larger cash reserves (9 to 12 months)
- Focus on tenant retention aggressively
- Consider offering lease renewal incentives
- Improve property to stay competitive
- Don't raise rents—focus on occupancy
Declining Market
Characteristics:
- Occupancy rates below 85%
- Rent decreases
- High vacancy rates
- Weak tenant demand
Break-Even Impact: Even low break-even points become challenging. Negative cash flow is common.
Example:
- Break-Even: 75%
- Market Occupancy: 82%
- Safety Margin: 7% (but occupancy is falling)
Strategy:
- Reduce expenses aggressively
- Consider short-term rentals if legal
- Add value to justify current rents
- Evaluate exit strategy
- Don't over-improve—market may not support higher rents
How to Lower Your Break-Even Point
Reducing your break-even point increases your safety margin and reduces risk.
Strategy 1: Refinance to a Lower Mortgage Payment
How It Works: Lower mortgage payment = lower total expenses = lower break-even point
Example: Before Refinance:
- Mortgage: $3,000/month
- Other Expenses: $1,500/month
- Total Expenses: $4,500
- Gross Rent: $6,000
- Break-Even: 75%
After Refinance:
- Mortgage: $2,400/month (refinanced at lower rate)
- Other Expenses: $1,500/month
- Total Expenses: $3,900
- Gross Rent: $6,000
- Break-Even: 65%
Impact: 10% lower break-even point.
When to Refinance:
- Interest rates drop 1%+ below your current rate
- You can extend the loan term to lower payment
- Closing costs can be recouped in 2 to 3 years
Strategy 2: Increase Rents
How It Works: Higher gross potential rent = lower break-even percentage
Example: Before Rent Increase:
- Total Expenses: $4,000/month
- Gross Rent: $5,000/month
- Break-Even: 80%
After Rent Increase:
- Total Expenses: $4,000/month
- Gross Rent: $5,500/month (10% increase)
- Break-Even: 72.7%
Impact: 7.3% lower break-even point.
How to Increase Rents Without Losing Tenants:
- Make value-add improvements (justify increases)
- Increase gradually (5% to 8% annually)
- Time increases with market rent growth
- Communicate value to tenants
Strategy 3: Reduce Operating Expenses
How It Works: Lower expenses = lower break-even point
Target Areas:
-
Property Taxes
- Appeal assessment if overvalued
- Potential savings: 10% to 20% of tax bill
-
Insurance
- Shop multiple providers annually
- Potential savings: 10% to 15%
-
Utilities
- Make tenants pay utilities (if currently owner-paid)
- Install energy-efficient systems
- Potential savings: $100 to $300/unit/month
-
Property Management
- Negotiate lower percentage
- Self-manage (if you have time)
- Potential savings: 2% to 4% of rent
-
Maintenance
- Preventive maintenance reduces emergency repairs
- Use reliable contractors (avoid callbacks)
- Potential savings: 10% to 20% of maintenance budget
Example: Before Expense Reduction:
- Expenses: $4,500/month
- Gross Rent: $6,000/month
- Break-Even: 75%
After Expense Reduction:
- Expenses: $3,900/month (saved $600)
- Gross Rent: $6,000/month
- Break-Even: 65%
Impact: 10% lower break-even point.
Strategy 4: Convert Fixed Expenses to Variable
How It Works: Variable expenses scale with occupancy, reducing break-even risk.
Examples:
-
Tenant-Paid Utilities
- Before: You pay $200/month regardless of occupancy
- After: Tenants pay directly—you pay $0
-
Percentage-Based Property Management
- Already variable (scales with collected rent)
-
Performance-Based Vendor Contracts
- Landscaping: Charge tenants directly
- Snow removal: Pass through to tenants
Impact on Break-Even:
Before:
- Fixed Expenses: $3,600 (90% of total)
- Variable Expenses: $400 (10% of total)
- Break-Even: 80%
After:
- Fixed Expenses: $2,800 (70% of total)
- Variable Expenses: $1,200 (30% of total)
- Break-Even: 70%
Why It Helps: When occupancy drops, so do your variable expenses, making it easier to break even.
Real-World Break-Even Examples
Example 1: The High Break-Even Mistake (Learning Experience)
Investor: Tom, age 38, software developer
Property:
- 4-unit apartment building in Sacramento, CA
- Purchase Price: $680,000
- Down Payment: 25% ($170,000)
- Mortgage: $510,000 at 6.5%, 30 years
Monthly Expenses:
- Mortgage (P&I): $3,226
- Property Tax: $850
- Insurance: $320
- Property Management (8%): $480 (at 100% occupancy)
- Maintenance Reserve: $400
- Utilities (owner-paid): $280
- Total: $5,556
Monthly Rent:
- 4 units × $1,500 = $6,000
Break-Even Analysis:
- Break-Even: $5,556 ÷ $6,000 = 92.6%
- Safety Margin: Only 7.4%
What Happened:
- Month 3: One unit vacant (occupancy drops to 75%)
- Monthly loss: -$1,056
- Unit took 2 months to re-rent
- Total loss: -$2,112
Tom's Realization: "I was losing money with just one vacancy. I had almost no safety margin. The cash flow looked good at 100% occupancy, but I didn't account for realistic vacancy rates."
Tom's Fix:
- Refinanced at 5.5% (saved $300/month on mortgage)
- Made tenants pay utilities (saved $280/month)
- New break-even: 84.3% (much better)
Example 2: The Low Break-Even Success Story
Investor: Maria, age 45, owns 8 rental properties
Property:
- 8-unit apartment building in Austin, TX
- Purchase Price: $800,000
- Down Payment: 30% ($240,000)
- Mortgage: $560,000 at 5%, 30 years
Monthly Expenses:
- Mortgage (P&I): $3,006
- Property Tax: $1,000
- Insurance: $350
- Property Management (8%): $704 (at 100% occupancy)
- Maintenance Reserve: $600
- Utilities (tenant-paid): $0
- Total: $5,660
Monthly Rent:
- 8 units × $1,100 = $8,800
Break-Even Analysis:
- Break-Even: $5,660 ÷ $8,800 = 64.3%
- Safety Margin: 35.7%
Why It Works:
- Lower leverage (30% down = lower mortgage)
- Tenants pay utilities (no fixed utility cost)
- Larger building spreads risk across more units
- Break-even requires only 5.1 of 8 units rented
Maria's Experience: "Even during COVID-19 when occupancy dropped to 75%, I was still cash flow positive. My low break-even point gave me flexibility to work with tenants and keep them in place."
5-Year Results:
- Average occupancy: 92%
- Never had negative cash flow month
- Raised rents 4% annually
- Break-even point dropped to 60% (due to rent increases)
Example 3: The Commercial Triple-Net Advantage
Investor: David, age 52, commercial real estate investor
Property:
- Small strip mall (4 tenants), Dallas, TX
- Purchase Price: $1,400,000
- Down Payment: 35% ($490,000)
- Mortgage: $910,000 at 5.5%, 25 years
Monthly Expenses:
- Mortgage (P&I): $5,573
- Property Tax: $2,000 (paid by tenants via triple-net)
- Insurance: $600 (paid by tenants via triple-net)
- CAM (Common Area Maintenance): $800 (paid by tenants via triple-net)
- Property Management: $500
- Total Owner Expense: $6,073
Monthly Rent:
- 4 tenants × average $4,500 = $18,000
- Tenants also pay $3,400/month in NNN charges
Break-Even Analysis:
- Break-Even: $6,073 ÷ $18,000 = 33.7%
- Safety Margin: 66.3%
Why It Works:
- Triple-net leases shift most expenses to tenants
- Only 1.3 of 4 tenants needed to break even
- Long lease terms (5 to 10 years) provide stability
- Creditworthy tenants (franchises, chains)
David's Strategy: "I target triple-net commercial properties because the break-even point is so low. I can handle extended vacancies while finding the right tenant. The trade-off is longer vacancy periods and higher tenant improvement costs."
Break-Even Analysis Red Flags
Red Flag 1: Break-Even Above 90%
Why It's Dangerous:
- Almost no margin for error
- One vacancy = immediate negative cash flow
- Unsustainable long-term
Action: Reconsider the investment or aggressively reduce expenses.
Red Flag 2: High Fixed Costs (Above 80% of Total)
Why It's Dangerous:
- Expenses don't scale down with vacancies
- Limited flexibility
- High risk in soft markets
Action: Convert fixed expenses to variable (make tenants pay utilities, etc.).
Red Flag 3: Break-Even Point Increasing Over Time
Why It's Dangerous:
- Expenses growing faster than rent
- Property becoming less profitable
- Trend will continue without intervention
Action: Analyze expense growth. Refinance, raise rents, or reduce costs.
Red Flag 4: Break-Even Point Higher Than Market Occupancy
Why It's Dangerous:
- You're operating at a loss
- Market conditions don't support profitability
- Need immediate action
Example:
- Your break-even: 85%
- Market average occupancy: 82%
- You're losing money most months
Action: Exit the investment or dramatically restructure finances.
Using Break-Even Analysis in Decision Making
Decision 1: Should I Buy This Property?
Calculate break-even before purchasing.
Rule of Thumb:
- Break-even under 70%: Strong buy signal
- Break-even 70% to 80%: Acceptable in stable markets
- Break-even 80% to 90%: Proceed with caution
- Break-even over 90%: Avoid (too risky)
Decision 2: Should I Refinance?
Refinancing can lower your break-even point.
Example:
- Current mortgage: $3,000/month
- Refinance saves $400/month
- New break-even: 6.7% lower
- Decision: Refinance if break-even will drop below 75%
Decision 3: Should I Raise Rents?
Higher rents lower break-even percentage but might increase vacancies.
Break-Even Analysis:
Scenario A: Don't Raise Rents
- Rent: $1,000/unit
- Occupancy: 95%
- Break-Even: 75%
- Safety Margin: 20%
Scenario B: Raise Rents 10%
- Rent: $1,100/unit
- Occupancy: 90% (lose some tenants)
- Break-Even: 68%
- Safety Margin: 22%
Decision: If raising rent lowers break-even point and you maintain adequate occupancy, it reduces risk.
Decision 4: Should I Sell or Hold?
Break-even analysis reveals whether the property is sustainable.
Sell Indicators:
- Break-even above 85% with no way to reduce
- Market occupancy dropping below your break-even
- Expenses growing faster than rents
Hold Indicators:
- Break-even under 75%
- Strong cash reserves
- Market conditions stable or improving
Break-Even Analysis Best Practices
1. Calculate Annually
Recalculate your break-even point every year.
Why:
- Expenses change (property taxes, insurance, maintenance)
- Rents change (market rates, increases)
- Your break-even point shifts
When to Recalculate:
- After major expense changes
- After refinancing
- After rent increases
- Annually as part of financial review
2. Use Conservative Assumptions
When calculating break-even for a new investment:
Conservative Assumptions:
- Assume 5% to 10% vacancy (even in strong markets)
- Budget for higher maintenance (10% to 15% of rent)
- Include property management (even if you self-manage now)
Why: Overestimating income and underestimating expenses leads to inflated cash flow projections and risky investments.
3. Track Break-Even vs Actual Occupancy
Monitor the gap between your break-even point and actual occupancy.
Example Dashboard:
Q1 2024:
- Break-Even: 72%
- Actual Occupancy: 94%
- Safety Margin: 22% ✓

Q2 2024:
- Break-Even: 72%
- Actual Occupancy: 88%
- Safety Margin: 16% ✓

Q3 2024:
- Break-Even: 72%
- Actual Occupancy: 78%
- Safety Margin: 6% ⚠️ (Take action)
4. Plan for Break-Even + 5% to 10%
Don't just plan to break even. Plan to operate at break-even + 5% to 10% minimum.
Why:
- Unexpected expenses
- Rent collection issues
- Turnover costs
- Market downturns
Safe Operating Range: If your break-even is 70%, operate at 80% to 85% minimum to have a cushion.
Frequently Asked Questions
What's a good break-even point for rental property?
Answer:
- Excellent: Below 65%
- Good: 65% to 75%
- Acceptable: 75% to 85% (in stable markets)
- Risky: 85% to 95%
- Very Risky: Above 95%
The "good" break-even point depends on property type, market conditions, and your risk tolerance.
Is a 75% break-even point good?
Answer: 75% is generally good for multi-family properties. It means you can lose 25% of your units and still break even.
However, context matters:
- Strong market (95%+ occupancy): 75% break-even is very safe
- Declining market (80% occupancy): 75% break-even is risky
How do I calculate break-even for a single-family rental?
Answer: Single-family rentals are either 100% occupied or 0% occupied. Calculate break-even occupancy over time.
Example:
- Monthly Expenses: $1,500
- Monthly Rent: $2,000
- Break-Even: $1,500 ÷ $2,000 = 75% over time
If your property is vacant more than 25% of the year (3 months), you lose money.
Typical Vacancy Rates:
- Strong market: 5% to 8% (0.5 to 1 month per year)
- Stable market: 8% to 12% (1 to 1.5 months per year)
- Soft market: 12% to 20% (1.5 to 2.5 months per year)
Should I include principal paydown in break-even analysis?
Answer: No. Break-even analysis focuses on cash flow (cash in vs cash out).
Principal paydown is equity building, not cash flow. You can't use equity to pay your monthly bills.
What to Include:
- Include: Mortgage payment (P&I)
- Exclude: Principal portion for wealth-building purposes
How does property management affect break-even?
Answer: Property management is a percentage of collected rent (typically 8% to 10%), so it's a variable expense.
Example:
- Gross Potential Rent: $5,000/month
- Management Fee: 8%
- At 100% occupancy: $400/month
- At 50% occupancy: $200/month
For break-even analysis, calculate management as a percentage of gross potential rent.
Can I lower my break-even point by paying down the mortgage?
Answer: Yes! Paying down the mortgage lowers your monthly payment, which lowers your break-even point.
Example: Before Extra Payments:
- Mortgage: $2,500/month
- Total Expenses: $3,500
- Gross Rent: $5,000
- Break-Even: 70%
After Paying Down $50,000:
- Mortgage: $2,200/month (lower payment)
- Total Expenses: $3,200
- Gross Rent: $5,000
- Break-Even: 64%
What if my break-even point is higher than market occupancy?
Answer: This is a serious problem. You're operating at a loss.
Immediate Actions:
- Reduce expenses aggressively (refinance, cut costs)
- Increase income (raise rents if possible)
- Evaluate exit strategy (selling may be best option)
Long-Term: If you can't fix it within 6 to 12 months, strongly consider selling.
How often should I recalculate my break-even point?
Answer: Recalculate annually and after any major change:
- After refinancing
- After significant expense increases (property tax, insurance)
- After rent increases
- After major renovations
- When market conditions shift
Does depreciation affect my break-even point?
Answer: No. Depreciation is a non-cash expense (tax deduction only). It doesn't affect your actual monthly cash flow.
What to Include in Break-Even:
- Include: All cash expenses (mortgage, tax, insurance, maintenance, etc.)
- Exclude: Non-cash items (depreciation)
Break-even analysis is about cash flow, not accounting profit.
Should I calculate break-even before or after property management fees?
Answer: Always include property management fees in your break-even calculation—even if you're currently self-managing.
Why:
- You might hire a property manager in the future
- It gives you a realistic picture of expenses
- Self-management has an opportunity cost (your time)
Best Practice: Budget 8% to 10% for property management in break-even analysis.
How do seasonal rentals affect break-even analysis?
Answer: Seasonal rentals require modified break-even analysis because occupancy varies dramatically by season.
Traditional Break-Even (Annual Occupancy):
- Calculate average occupancy over 12 months
- Account for high season and low season
Example: Beach Rental
- High Season (June-August): 95% occupancy
- Shoulder Season (April-May, Sept-Oct): 60% occupancy
- Low Season (Nov-March): 20% occupancy
- Annual Average Occupancy: 55%
Break-Even Calculation:
- Total Annual Expenses: $48,000
- Gross Annual Rent Potential: $72,000 (assuming $6,000/month average)
- Break-Even: 66.7%
Is 55% Occupancy Profitable? No—you're operating below break-even (66.7%).
Action Required:
- Raise rates in high season
- Market more aggressively in shoulder season
- Reduce expenses
- Consider long-term rental conversion
Can I use break-even analysis for Airbnb or short-term rentals?
Answer: Yes, but calculate it differently because rates and occupancy vary more than long-term rentals.
Airbnb Break-Even Formula:
Break-Even Occupancy = Monthly Expenses ÷ (Average Nightly Rate × 30 days)
Example:
- Monthly Expenses: $2,500
- Average Nightly Rate: $150
- Gross Potential: $150 × 30 = $4,500
- Break-Even: $2,500 ÷ $4,500 = 55.6%
You need at least 16.7 nights booked per month (55.6% of 30 days).
Variables to Consider:
- Seasonality (occupancy varies month to month)
- Dynamic pricing (rates change based on demand)
- Higher variable costs (cleaning, supplies, utilities)
Best Practice: Calculate break-even for each season separately.
What's the break-even point for a property with no mortgage?
Answer: Properties with no mortgage have very low break-even points because fixed expenses are minimal.
Example:
-
No Mortgage: $0
-
Property Tax: $500/month
-
Insurance: $150/month
-
Maintenance: $300/month
-
Management: $240/month (8% of $3,000 rent)
-
Total Expenses: $1,190/month
-
Gross Rent: $3,000/month
-
Break-Even: $1,190 ÷ $3,000 = 39.7%
Advantage: Extremely low risk. You can operate profitably at very low occupancy.
Strategy: Many retirees pay off rental properties to create stable, low-risk income.
How do I account for capital expenditures (CapEx) in break-even?
Answer: Capital expenditures (roof, HVAC, appliances) should be included as a monthly reserve in your break-even calculation.
CapEx Reserve Calculation:
- Estimate total CapEx over property lifespan
- Divide by number of years
- Divide by 12 months
Example:
- Roof replacement: $15,000 (every 20 years) = $750/year = $62.50/month
- HVAC replacement: $8,000 (every 15 years) = $533/year = $44/month
- Appliances: $3,000 (every 10 years) = $300/year = $25/month
- Total CapEx Reserve: $131.50/month
Include this $131.50/month in your total expenses for break-even calculation.
Why It Matters: Without a CapEx reserve, your break-even analysis is unrealistic. When the roof fails, you'll need $15,000 and may not have it.
What if my break-even analysis shows I'm in trouble?
Answer: If your break-even point is too high (above 85%) or you're operating below break-even, take immediate action:
Short-Term Actions (0-3 Months):
- Build cash reserves (cover 3 to 6 months of expenses)
- Stop all non-essential spending
- Delay capital improvements
- Focus on filling vacancies (even at slightly reduced rent)
Medium-Term Actions (3-12 Months):
- Refinance to lower mortgage payment
- Appeal property tax assessment
- Shop for lower insurance rates
- Increase rents on lease renewals (if market allows)
- Make value-add improvements to justify rent increases
Long-Term Actions (12+ Months):
- Evaluate whether the property is sustainable
- Consider selling if you can't improve break-even
- Look for better markets or property types
- Pay down mortgage to lower break-even
When to Sell:
- Break-even over 90% with no viable improvement plan
- Market occupancy consistently below your break-even
- You've been operating at a loss for 12+ months
- Expenses growing faster than rents with no end in sight
Don't hold onto a failing investment hoping it turns around. Sometimes selling and redeploying capital is the best decision.
Break-Even Analysis Myths Debunked
Myth 1: "Higher Cash Flow Means Better Investment"
The Truth: A property with high cash flow at 100% occupancy but a 90% break-even point is riskier than a property with moderate cash flow and a 60% break-even point.
Example:
Property A: High Cash Flow, High Risk
- Cash Flow at 100%: $2,000/month
- Break-Even: 90%
- One vacancy: -$500/month (loss)
Property B: Moderate Cash Flow, Low Risk
- Cash Flow at 100%: $1,500/month
- Break-Even: 60%
- One vacancy: +$800/month (still profitable)
Lesson: Focus on risk-adjusted returns, not just total cash flow.
Myth 2: "Break-Even Analysis Only Matters for Multi-Family"
The Truth: Break-even analysis is critical for all rental properties, including single-family homes.
Single-family rentals are either 100% occupied or 0% occupied. Understanding how many months of vacancy you can afford per year is essential.
Example:
- Break-Even: 75%
- You can afford 3 months of vacancy per year (25%)
- If turnover plus vacancy exceeds 3 months, you lose money
Lesson: Break-even analysis applies to all property types.
Myth 3: "Low Break-Even Means Low Returns"
The Truth: Low break-even doesn't mean low returns. It means lower risk.
You can have both:
- Low break-even (safe)
- Strong cash-on-cash return
- Healthy appreciation
Example:
- Purchase Price: $250,000
- Down Payment: 30% ($75,000)
- Break-Even: 62% (low risk)
- Cash Flow: $800/month
- Cash-on-Cash Return: 12.8%
- Appreciation: 4%/year
Lesson: Target properties with low break-even AND strong returns.
Myth 4: "Break-Even Doesn't Matter in Appreciation Markets"
The Truth: Even in high-appreciation markets, cash flow and break-even matter for sustainability.
If you're losing money every month waiting for appreciation, you might run out of cash before you can sell.
Example: San Francisco 2010-2020
- Property appreciated 150%
- But many investors with high break-even points (90%+) sold early because they couldn't sustain negative cash flow during soft periods
Lesson: Appreciation is great, but you still need to survive monthly cash flow.
Myth 5: "Break-Even Analysis Is Too Simple to Be Useful"
The Truth: Simple doesn't mean ineffective. Break-even analysis is powerful precisely because it's simple and actionable.
Complex metrics (IRR, NPV) are useful but harder to act on. Break-even occupancy is intuitive:
- "I need 8 of 10 units rented to break even"
- "I'm currently at 7—I need to fill one more unit"
Lesson: Simple metrics drive better decision-making.
Integrating Break-Even Analysis with Other Metrics
Break-even analysis works best when combined with other investment metrics:
Break-Even + Cash-on-Cash Return
Cash-on-Cash Return:
CoC Return = Annual Cash Flow ÷ Total Cash Invested
Example:
- Annual Cash Flow: $12,000
- Total Cash Invested: $100,000
- CoC Return: 12%
Combined Analysis:
- Break-Even: 68%
- CoC Return: 12%
- Interpretation: Strong return with low risk
Red Flag Combination:
- Break-Even: 88%
- CoC Return: 15%
- Interpretation: High return but very risky—unsustainable
Break-Even + Debt Service Coverage Ratio (DSCR)
DSCR:
DSCR = Net Operating Income ÷ Annual Debt Service
Commercial lenders require DSCR of 1.20 to 1.25.
Example:
- NOI: $60,000/year
- Annual Debt Service: $48,000
- DSCR: 1.25 (qualifies)
Break-Even Connection:
- High break-even (85%+) often correlates with low DSCR (under 1.20)
- Low break-even (65%) often correlates with strong DSCR (1.30+)
Combined Analysis:
- Break-Even: 70%
- DSCR: 1.28
- Interpretation: Low risk, strong lender appeal
Break-Even + Cap Rate
Cap Rate:
Cap Rate = Net Operating Income ÷ Property Value
Example:
- NOI: $50,000
- Property Value: $625,000
- Cap Rate: 8%
Combined Analysis:
- Break-Even: 65%
- Cap Rate: 8%
- Interpretation: Good income relative to value, low risk
Red Flag:
- Break-Even: 90%
- Cap Rate: 4%
- Interpretation: Expensive property with high risk—thin margins
Conclusion: Break-Even Analysis is Your Risk Management Tool
Break-even analysis answers the most important question in rental property investing: How much occupancy do I need to avoid losing money?
It's not glamorous. It won't predict appreciation. But it will tell you whether your investment is sustainable and how vulnerable you are to market downturns.
The Break-Even Mindset:
- Calculate it before you buy
- Monitor it quarterly
- Lower it over time
- Use it to guide decisions
Target Guidelines:
- Excellent: Under 65% (very safe)
- Good: 65% to 75% (sustainable)
- Acceptable: 75% to 85% (requires attention)
- Risky: 85% to 95% (vulnerable)
- Dangerous: Over 95% (avoid)
Action Steps:
- Calculate your break-even point today
- Compare it to your actual occupancy
- Assess your safety margin
- Develop a plan to lower break-even (if needed)
- Monitor quarterly
Master break-even analysis and you'll make smarter acquisition decisions, manage risk better, and build a more sustainable rental property portfolio.
Advanced Break-Even Strategies
Strategy 1: The Ladder Approach (Staggered Break-Even Points)
Smart investors target different break-even points for different stages of property ownership.
Year 1 to 3: Higher Break-Even Acceptable (75% to 80%)
- Building equity through mortgage paydown
- Property appreciating
- Learning the market
- Goal: Positive cash flow, build reserves
Year 4 to 7: Lower Break-Even Target (65% to 75%)
- Refinance to lower payment
- Rents increased with market
- Operating efficiencies improved
- Goal: Stronger cash flow, lower risk
Year 8+: Very Low Break-Even (Under 65%)
- Significant equity built
- Mortgage balance much lower
- Consider refinancing again or paying off
- Goal: Maximum cash flow, minimal risk
Example Timeline:
- Year 1: Break-even 78%, mortgage $3,000
- Year 5: Refinance, break-even 70%, mortgage $2,600
- Year 10: Major paydown, break-even 60%, mortgage $2,000
- Year 15: Mortgage paid off, break-even 35%, no mortgage
Result: Your investment becomes progressively safer over time.
Strategy 2: The Safety Margin Fund
Create a dedicated fund equal to 3 to 6 months of expenses at your break-even point.
How It Works:
Property Details:
- Total Monthly Expenses: $4,000
- Break-Even: 75%
- Safety Margin Fund Target: $12,000 to $24,000 (3 to 6 months)
Fund Purpose:
- Cover expenses during vacancy periods
- Bridge gaps between tenants
- Handle emergency repairs
- Provide psychological comfort
Funding Strategy:
- Set aside 20% to 30% of monthly cash flow
- Target: 3 months of expenses in first year
- Build to 6 months by year 2
- Maintain fund, replenish after use
Example:
- Monthly Cash Flow: +$1,000
- Fund Contribution: $300/month (30%)
- Time to 3-Month Fund: 40 months ($12,000 ÷ $300)
- Time to 6-Month Fund: 80 months ($24,000 ÷ $300)
Benefit: Even if occupancy drops below break-even, you can operate for months without stress.
Strategy 3: Dynamic Pricing to Maintain Occupancy Above Break-Even
Adjust rents dynamically based on occupancy levels and your break-even point.
The Dynamic Pricing Model:
Scenario: 8-Unit Property
- Break-Even: 70% (5.6 units)
- Current Occupancy: 6 units (75%)
- Safety Margin: Small (only 0.4 units above break-even)
Dynamic Pricing Response:
When Occupancy is High (Above 85%):
- Charge market rate or slightly above
- Goal: Maximize revenue
- Example: $1,200/unit
When Occupancy is Moderate (70% to 85%):
- Charge market rate
- Goal: Balance occupancy and revenue
- Example: $1,150/unit
When Occupancy is Low (Below 70%, near or below break-even):
- Offer concessions or reduce rent slightly
- Goal: Fill units quickly to get above break-even
- Example: $1,100/unit or 1 month free
Why It Works:
- Prioritizes staying above break-even
- Flexibility to fill vacancies fast
- Avoids extended negative cash flow
Caution: Don't yo-yo rents for existing tenants. Use dynamic pricing for new leases and renewals only.
Strategy 4: Value-Add Improvements to Lower Break-Even Percentage
Value-add improvements increase rents, which lowers break-even percentage.
Example:
Before Improvements:
- Total Expenses: $5,000/month
- Gross Rent: $6,500/month (4 units × $1,625)
- Break-Even: 76.9%
Value-Add Improvements ($30,000 invested):
- Upgraded kitchens ($7,500/unit)
- New flooring
- Fresh paint
- Modernized bathrooms
After Improvements:
- Total Expenses: $5,200/month (+$200 for reserve replenishment)
- Gross Rent: $7,600/month (4 units × $1,900, +$275/unit)
- Break-Even: 68.4%
Impact:
- Break-even dropped 8.5%
- Monthly cash flow increased $900
- ROI on improvements: 36% annually ($900 × 12 ÷ $30,000)
Best Value-Add Improvements for Lowering Break-Even:
- Kitchen upgrades (biggest rent boost)
- Bathroom remodels
- Flooring (luxury vinyl plank)
- In-unit washer/dryer
- Modern fixtures and finishes
Strategy 5: Portfolio-Level Break-Even Analysis
Analyze break-even across your entire portfolio, not just individual properties.
The Portfolio Approach:
Property A:
- Expenses: $3,000/month
- Gross Rent: $4,000/month
- Break-Even: 75%
- Current Occupancy: 80%
- Cash Flow: +$200/month
Property B:
- Expenses: $2,500/month
- Gross Rent: $5,000/month
- Break-Even: 50%
- Current Occupancy: 95%
- Cash Flow: +$2,250/month
Property C:
- Expenses: $4,000/month
- Gross Rent: $5,000/month
- Break-Even: 80%
- Current Occupancy: 70%
- Cash Flow: -$500/month
Portfolio Analysis:
- Combined Expenses: $9,500/month
- Combined Gross Rent: $14,000/month
- Portfolio Break-Even: 67.9%
- Portfolio Occupancy: 81.7%
- Combined Cash Flow: +$1,950/month
Insight: Property C is below break-even individually, but the portfolio is healthy overall.
Portfolio Strategy:
- Property B (strong performer) subsidizes Property C temporarily
- Work to improve Property C (reduce expenses, increase rents)
- Don't panic-sell Property C if portfolio is sustainable
- Use strong properties to buy time for weaker properties
Break-Even Analysis for Different Financing Structures
Traditional 30-Year Mortgage
Characteristics:
- Lower monthly payment
- Longer amortization
- Lower break-even point initially
Example:
- Loan: $400,000 at 6%, 30 years
- Monthly P&I: $2,398
- Total Expenses: $3,500
- Gross Rent: $5,000
- Break-Even: 70%
Pros:
- Lower break-even point
- More cash flow in early years
- Easier to stay above break-even
Cons:
- Slower equity build
- More interest paid over life of loan
15-Year Mortgage
Characteristics:
- Higher monthly payment
- Faster amortization
- Higher break-even point initially
Example:
- Loan: $400,000 at 5.5%, 15 years
- Monthly P&I: $3,266
- Total Expenses: $4,368
- Gross Rent: $5,000
- Break-Even: 87.4%
Pros:
- Build equity faster
- Lower interest paid over life
- Paid off in half the time
Cons:
- Higher break-even point (risky)
- Less cash flow early on
- Harder to handle vacancies
Strategy: Only use 15-year mortgages if break-even stays under 75%. Otherwise, take 30-year and make extra principal payments voluntarily.
Interest-Only Loan
Characteristics:
- Lowest monthly payment
- No principal paydown
- Lowest break-even point
Example:
- Loan: $400,000 at 6.5%, interest-only 10 years
- Monthly Payment: $2,167 (interest only)
- Total Expenses: $3,269
- Gross Rent: $5,000
- Break-Even: 65.4%
Pros:
- Lowest break-even point
- Maximum cash flow
- Flexibility in early years
Cons:
- Not building equity via paydown
- Balloon payment or refinance required
- Riskier if property doesn't appreciate
When to Use:
- Short-term hold (fix-and-flip or value-add)
- Planning to refinance or sell before balloon
- High-appreciation market
Commercial Loan (5+ Units)
Characteristics:
- Debt Service Coverage Ratio (DSCR) requirement
- Shorter amortization (20 to 25 years typical)
- Based on property income, not personal credit
Example:
- Loan: $800,000 at 6%, 25 years
- Monthly P&I: $5,155
- Total Expenses: $7,000
- Gross Rent: $12,000
- Break-Even: 58.3%
DSCR Requirement: Most lenders require DSCR of 1.20 to 1.25.
DSCR Formula:
DSCR = Net Operating Income ÷ Annual Debt Service
Example:
- NOI: $60,000/year ($12,000 rent - $7,000 expenses) × 12
- Annual Debt Service: $61,860 ($5,155 × 12)
- DSCR: $60,000 ÷ $61,860 = 0.97 (Does NOT qualify)
To Qualify: You need higher NOI or lower debt service to hit 1.20 DSCR.
Break-Even Connection: Commercial lenders evaluate break-even and DSCR to assess loan risk.
Case Study: Turning Around a High Break-Even Property
Investor: Jessica, age 40, owns 3 rental properties
The Problem Property:
- 6-unit apartment building, Cleveland, OH
- Purchase Price: $360,000
- Mortgage: $300,000 at 6.5%, 30 years
- Purchased 3 years ago
Initial Financials:
- Monthly Expenses: $4,200
- Gross Rent: $4,800 (6 units × $800/unit)
- Break-Even: 87.5% (5.25 units)
- Current Occupancy: 83% (5 units rented)
- Monthly Cash Flow: -$220 (losing money)
The Situation: Jessica bought the property assuming 95% occupancy, but the neighborhood declined slightly and occupancy dropped to 80% to 85%. She's been losing money for 8 months.
Break-Even Analysis:
- Break-Even: 87.5%
- Actual Occupancy: 83%
- Gap: -4.5% (below break-even)
- Needs at least 5.3 units rented to break even (currently 5)
Jessica's Turnaround Plan:
Phase 1: Immediate Expense Reduction (Month 1-2)
-
Refinance mortgage
- New rate: 5.5%, 30 years
- Old payment: $1,900
- New payment: $1,703
- Savings: $197/month
-
Shop insurance
- Old premium: $280/month
- New premium: $220/month
- Savings: $60/month
-
Negotiate property management
- Old rate: 10%
- New rate: 8%
- Savings: ~$80/month (at full occupancy)
Total Expense Reduction: $337/month
New Break-Even:
- Monthly Expenses: $3,863 (down from $4,200)
- Gross Rent: $4,800
- Break-Even: 80.5% (down from 87.5%)
Phase 2: Revenue Increase (Month 3-6)
-
Value-add improvements ($12,000 invested):
- New flooring in all units: $6,000
- Fresh paint: $2,400
- Updated lighting fixtures: $1,800
- Landscaping cleanup: $1,800
-
Raise rents on turnover:
- Old rent: $800/unit
- New rent: $900/unit (justified by improvements)
- Phased in as leases renew
New Break-Even After 12 Months:
- Monthly Expenses: $3,963 (+$100 for reserves to recoup improvements)
- Gross Rent: $5,400 (6 units × $900)
- Break-Even: 73.4%
Phase 3: Tenant Retention (Ongoing)
- Respond to maintenance requests within 24 hours
- Offer $50/month rent discount for 12-month lease renewals (vs month-to-month)
- Annual tenant appreciation event ($300/year)
- Improved communication
Results After 18 Months:
- Occupancy: 92% (5.5 units average)
- Monthly Cash Flow: +$625
- Break-Even: 73.4%
- Safety Margin: 18.6%
Jessica's Takeaway: "I went from losing money every month to cash flowing $625. The key was attacking both sides: reducing expenses AND increasing rents. Lowering my break-even point from 87.5% to 73.4% completely changed the investment."
Total Investment to Turn Around: $15,000
- Refinance costs: $3,000
- Value-add improvements: $12,000
ROI: $625/month × 12 = $7,500/year ÷ $15,000 = 50% annual return on turnaround investment
Tools and Resources for Break-Even Analysis
Spreadsheet Templates
Build a simple break-even tracker in Excel or Google Sheets:
Column A: Expense Category Column B: Monthly Amount Column C: Fixed or Variable Column D: Notes
Row Totals:
- Total Fixed Expenses
- Total Variable Expenses
- Total Expenses
Break-Even Calculation:
- Gross Potential Rent (separate cell)
- Break-Even %: =Total Expenses / Gross Rent
- Break-Even Units: =Break-Even % × Number of Units
Track Quarterly:
- Q1, Q2, Q3, Q4 break-even trend
- Overlay actual occupancy
- Calculate safety margin
Property Management Software
Many property management platforms include break-even analysis:
Features to Look For:
- Automated expense tracking
- Rent roll and occupancy tracking
- Break-even dashboard
- Scenario modeling (what-if analysis)
- Alerts when occupancy drops near break-even
Popular Software:
- AppFolio: Break-even and occupancy dashboards
- Buildium: Financial reporting with break-even analysis
- TenantCloud: Basic break-even tracking
- Rent Manager: Advanced financial analytics
Hire a Property Management Company
Professional property managers can help optimize break-even:
How They Help:
- Reduce vacancy through professional marketing
- Screen tenants (reduce turnover)
- Maintain properties (retain tenants longer)
- Optimize pricing (market analysis)
- Control expenses (vendor relationships)
Cost: 8% to 10% of collected rent
When It Makes Sense:
- If self-managing is costing you 15%+ vacancy
- If your break-even is above 80% and you need help
- If you own multiple properties
ROI Example:
- Old vacancy rate (self-managed): 15%
- New vacancy rate (pro-managed): 8%
- Management cost: 8%
- Net improvement: 7% less total vacancy
- Break-even improvement: Lower due to better occupancy
Break-Even Analysis Checklist
Use this checklist to perform a complete break-even analysis:
Data Collection
- [ ] List all fixed expenses (mortgage, tax, insurance, HOA)
- [ ] List all variable expenses (utilities, management, maintenance)
- [ ] Calculate total monthly expenses
- [ ] Determine number of units
- [ ] Determine average rent per unit
- [ ] Calculate gross potential rent
Break-Even Calculation
- [ ] Calculate break-even occupancy percentage
- [ ] Calculate break-even number of units
- [ ] Determine current actual occupancy
- [ ] Calculate safety margin
Risk Assessment
- [ ] Categorize break-even as Low (under 70%), Moderate (70% to 85%), or High (over 85%)
- [ ] Compare break-even to market average occupancy
- [ ] Identify how many vacant units trigger break-even
- [ ] Assess seasonality and vacancy trends
Strategy Development
- [ ] Identify opportunities to reduce fixed expenses
- [ ] Identify opportunities to convert fixed to variable expenses
- [ ] Evaluate refinancing options
- [ ] Analyze rent increase potential
- [ ] Plan value-add improvements (if needed)
- [ ] Determine target break-even point
Ongoing Monitoring
- [ ] Set up quarterly break-even review
- [ ] Track actual occupancy vs break-even
- [ ] Monitor expense trends
- [ ] Monitor rent trends
- [ ] Update break-even after major changes
Final Thoughts: Master Break-Even Analysis to Reduce Risk
Break-even analysis is one of the simplest yet most powerful tools for evaluating rental property risk. Unlike complex metrics such as IRR or DSCR, break-even occupancy is intuitive: what's the minimum occupancy I need to avoid losing money?
Key Takeaways:
-
Know Your Number: Calculate your break-even occupancy and monitor it quarterly.
-
Target Under 75%: Aim for break-even under 75% for sustainable, low-risk investments.
-
Build Safety Margin: Operate at least 10% to 15% above your break-even point.
-
Lower Break-Even Over Time: Use refinancing, rent increases, and expense reduction to lower break-even as you hold the property.
-
Context Matters: A 75% break-even in a 95% occupancy market is great. A 75% break-even in an 80% occupancy market is risky.
-
Act Early: If occupancy drops close to break-even, take immediate action. Don't wait for negative cash flow.
-
Portfolio View: Evaluate break-even across your entire portfolio, not just individual properties.
Break-even analysis won't predict appreciation or tell you if a property will make you rich. But it will tell you if a property is sustainable and how much risk you're taking. Master this tool, and you'll avoid many costly mistakes.
Ready to Calculate Your Break-Even Point?
Use our break-even calculator above to instantly determine your minimum occupancy and safety margin. Enter your property details and get results in seconds!
Next Steps:
- Calculate your break-even occupancy percentage
- Assess your risk level (High, Moderate, or Low)
- Compare your break-even to market average occupancy
- Implement strategies to lower your break-even point
- Monitor quarterly and adjust as needed
Understanding your break-even point is essential for long-term success in rental property investing. Calculate it today and take control of your investment risk!
Related Content
📝 Best Cities to Invest in Rental Properties: 2026 Analysis
Best cities for rental property investment in 2026. Analysis of ROI, population growth, job markets, and opportunities.
📝 Free Multi-Unit Property Calculator | Analyze Duplexes to Apartments
Read more about this topic
📝 2026 Rental Market Trends: What Property Owners Need to Know
2026 rental market trends: rent growth, occupancy rates, market shifts, and investment opportunities for landlords.
🔧 ROI Calculator
Calculate return on investment
🔧 Property Investment Analyzer
Comprehensive property analysis tool
🔧 BRRRR Calculator
Analyze buy-rehab-rent-refinance deals